48 hours of public OpenStatus
Aug 02, 2023 | by Maximilian Kaske | [company]

48 hours of Rollercoaster 🎢
The past two days following the launch have been incredibly hectic. The level of interest we received exceeded our expectations. We were even trending on GitHub. The number of users and created monitors far surpassed what we anticipated. We sincerely appreciate your support, as it further motivates us. The raw statistics are astonishing:
- Monitors: 315
- Users: 418
- Status pages: 174
With a large user base comes great responsibility. Thanks to the high volume of users, we discovered several flaws in our system. We promptly addressed the issues and took action.
Limits we encountered 😱
We conducted a DDOS attack on Vercel's firewalls from Upstash servers because we where pining every single vercel region for every monitor (18 * 315 = 5.670) more or less at once. Before considering the removal of QStash, we implemented a hotfix to introduce random delays of 0 to 180 seconds between each ping. This prevented us from overwhelming Vercel with simultaneous requests, significantly reducing the number of retries on QStash. As a result of these measures, we now have a randomized check interval of 0 to 90 seconds.
For the time being, we will keep it to ensure that every check is successfully processed.

Moreover, our actions caused the /monitor/[id]/data data-table to break. We
were storing the metadata res.text() in Tinybird and retrieving it with the
query SELECT * from monitors WHERE .... This means that if the text is in HTML
format, we store the HTML content of the page, which is acceptable. However,
this led to quickly exceeding the 100MB limit for the result length when
accessing monitor data. Now, we are only querying the necessary data from
tinybird: SELECT latency, timestamp, url, ... from monitors WHERE .... Despite
this, we continue to ingest the data and will only request it in the future when
you click on the "View metadata" action.
And of course no need to mention all the little hotfixed we had to make here and there.
What would it cost us? 💸
Let's break the current numbers a bit more down if we would have kept pinging all the regions:
- Number of checks every 10min: 315 * 18 regions = 5.670
- Number of checks every 1h: 5.670 * 6 = 34.020
- Number of checks every day: 34.020 * 24 = 816.480

We have resolved an issue with regex invocation in the edge middleware. Previously, it was being called whenever an API endpoint was called.
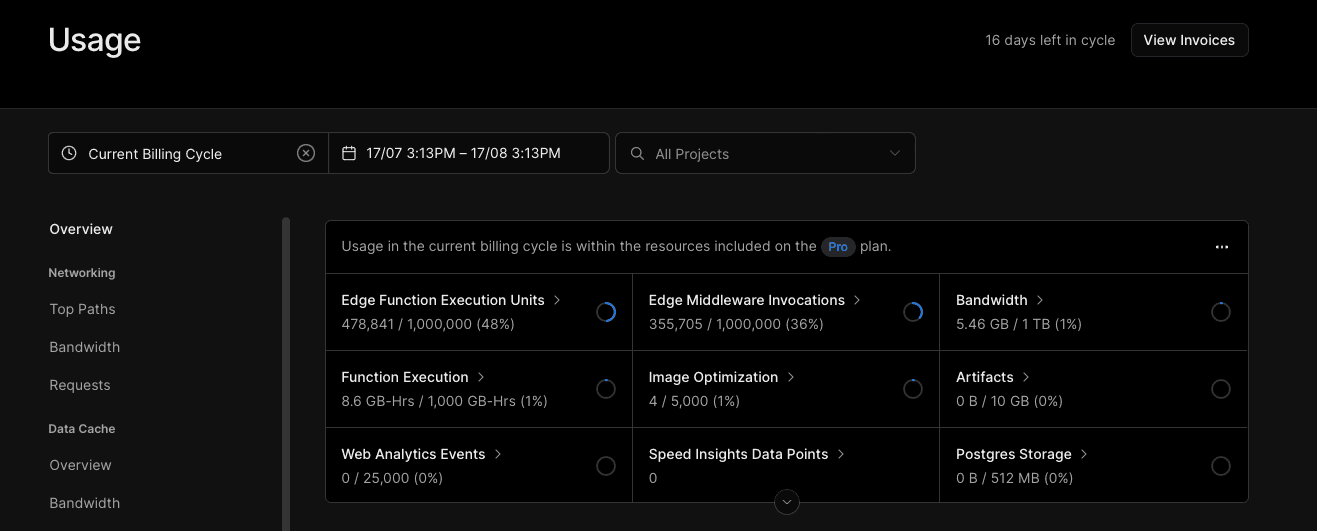
Under Vercel's Pro plan, we have 1 million edge function executions included, and for each additional 1 million, there is a $2 charge. Because the numbers are constant, we would have payed 1$/100k Qstash messages which would lead us to a approx. 10$/day for the current free tiers.
Actions taken 👷
But due to the high cost of our current infrastructure, we have downgraded all
monitors to a single region (/regions/auto, a which will take a random
vercel region) in order to stay within a reasonable budget, by dividing it
by 18. You can edit the region for each monitor. We apologize for any
inconvenience caused and will update you on the new conditions once everything
is normalized.
A big appreciation to @chronark_ who joined us on a call to discuss potential solutions and for sharing his knowledge about his own service, planetfall.io.
Also, Guilherme had a very good comment:
As a result of this incident, we will be reevaluating the prices and plans displayed on our homepage.
Join Discord if you want to learn more or just have a chat!
Again, thank you for all your support and your understanding. 🙏
P.S. We are generating your workspace-slug by merging two random names. Create an account on openstatus and share yours on Discord - it's fun to watch! 🍿

