Uptime monitoring for websites and APIs
Monitor website and API uptime from around the world. Get instant downtime alerts via Slack, email and SMS. Free, open-source uptime monitoring
+----------------+
| Service to be  |
| Monitored      |
+----------------+
      ▲
      |
      |   (Network Latency/Failures)
      |
+-----+-------+   +-----+-------+   +-----+-------+
| Monitoring  |   | Monitoring  |   | Monitoring  |
| Node (USA)  |   | Node (EU)   |   | Node (Asia) |
+-----+-------+   +-----+-------+   +-----+-------+
      |               |                 |
      |---------------|-----------------|
      ▼               ▼                 ▼
+------------------------------------------------+
|                 openstatus                     |
|                                                |
| - Sends automated requests (e.g., pings or     |
|   HTTP checks) from all nodes at set intervals |
| - Records response time and success/failure    |
| - Compares results from different nodes        |
| - If a failure or a slow response is detected, |
|   it triggers an alert.                        |
+------------------------------------------------+
      |
      | (Alerts: Email, SMS, Slack, etc.) 🔔
      |
+-----+-----+
| Your Team |
+-----------+
Why uptime monitoring is important?
Uptime monitoring is your first line of defense to ensure your service is available for your customers. By monitoring your service from multiple regions around the world, you can be sure that your customers are able to reach your service.
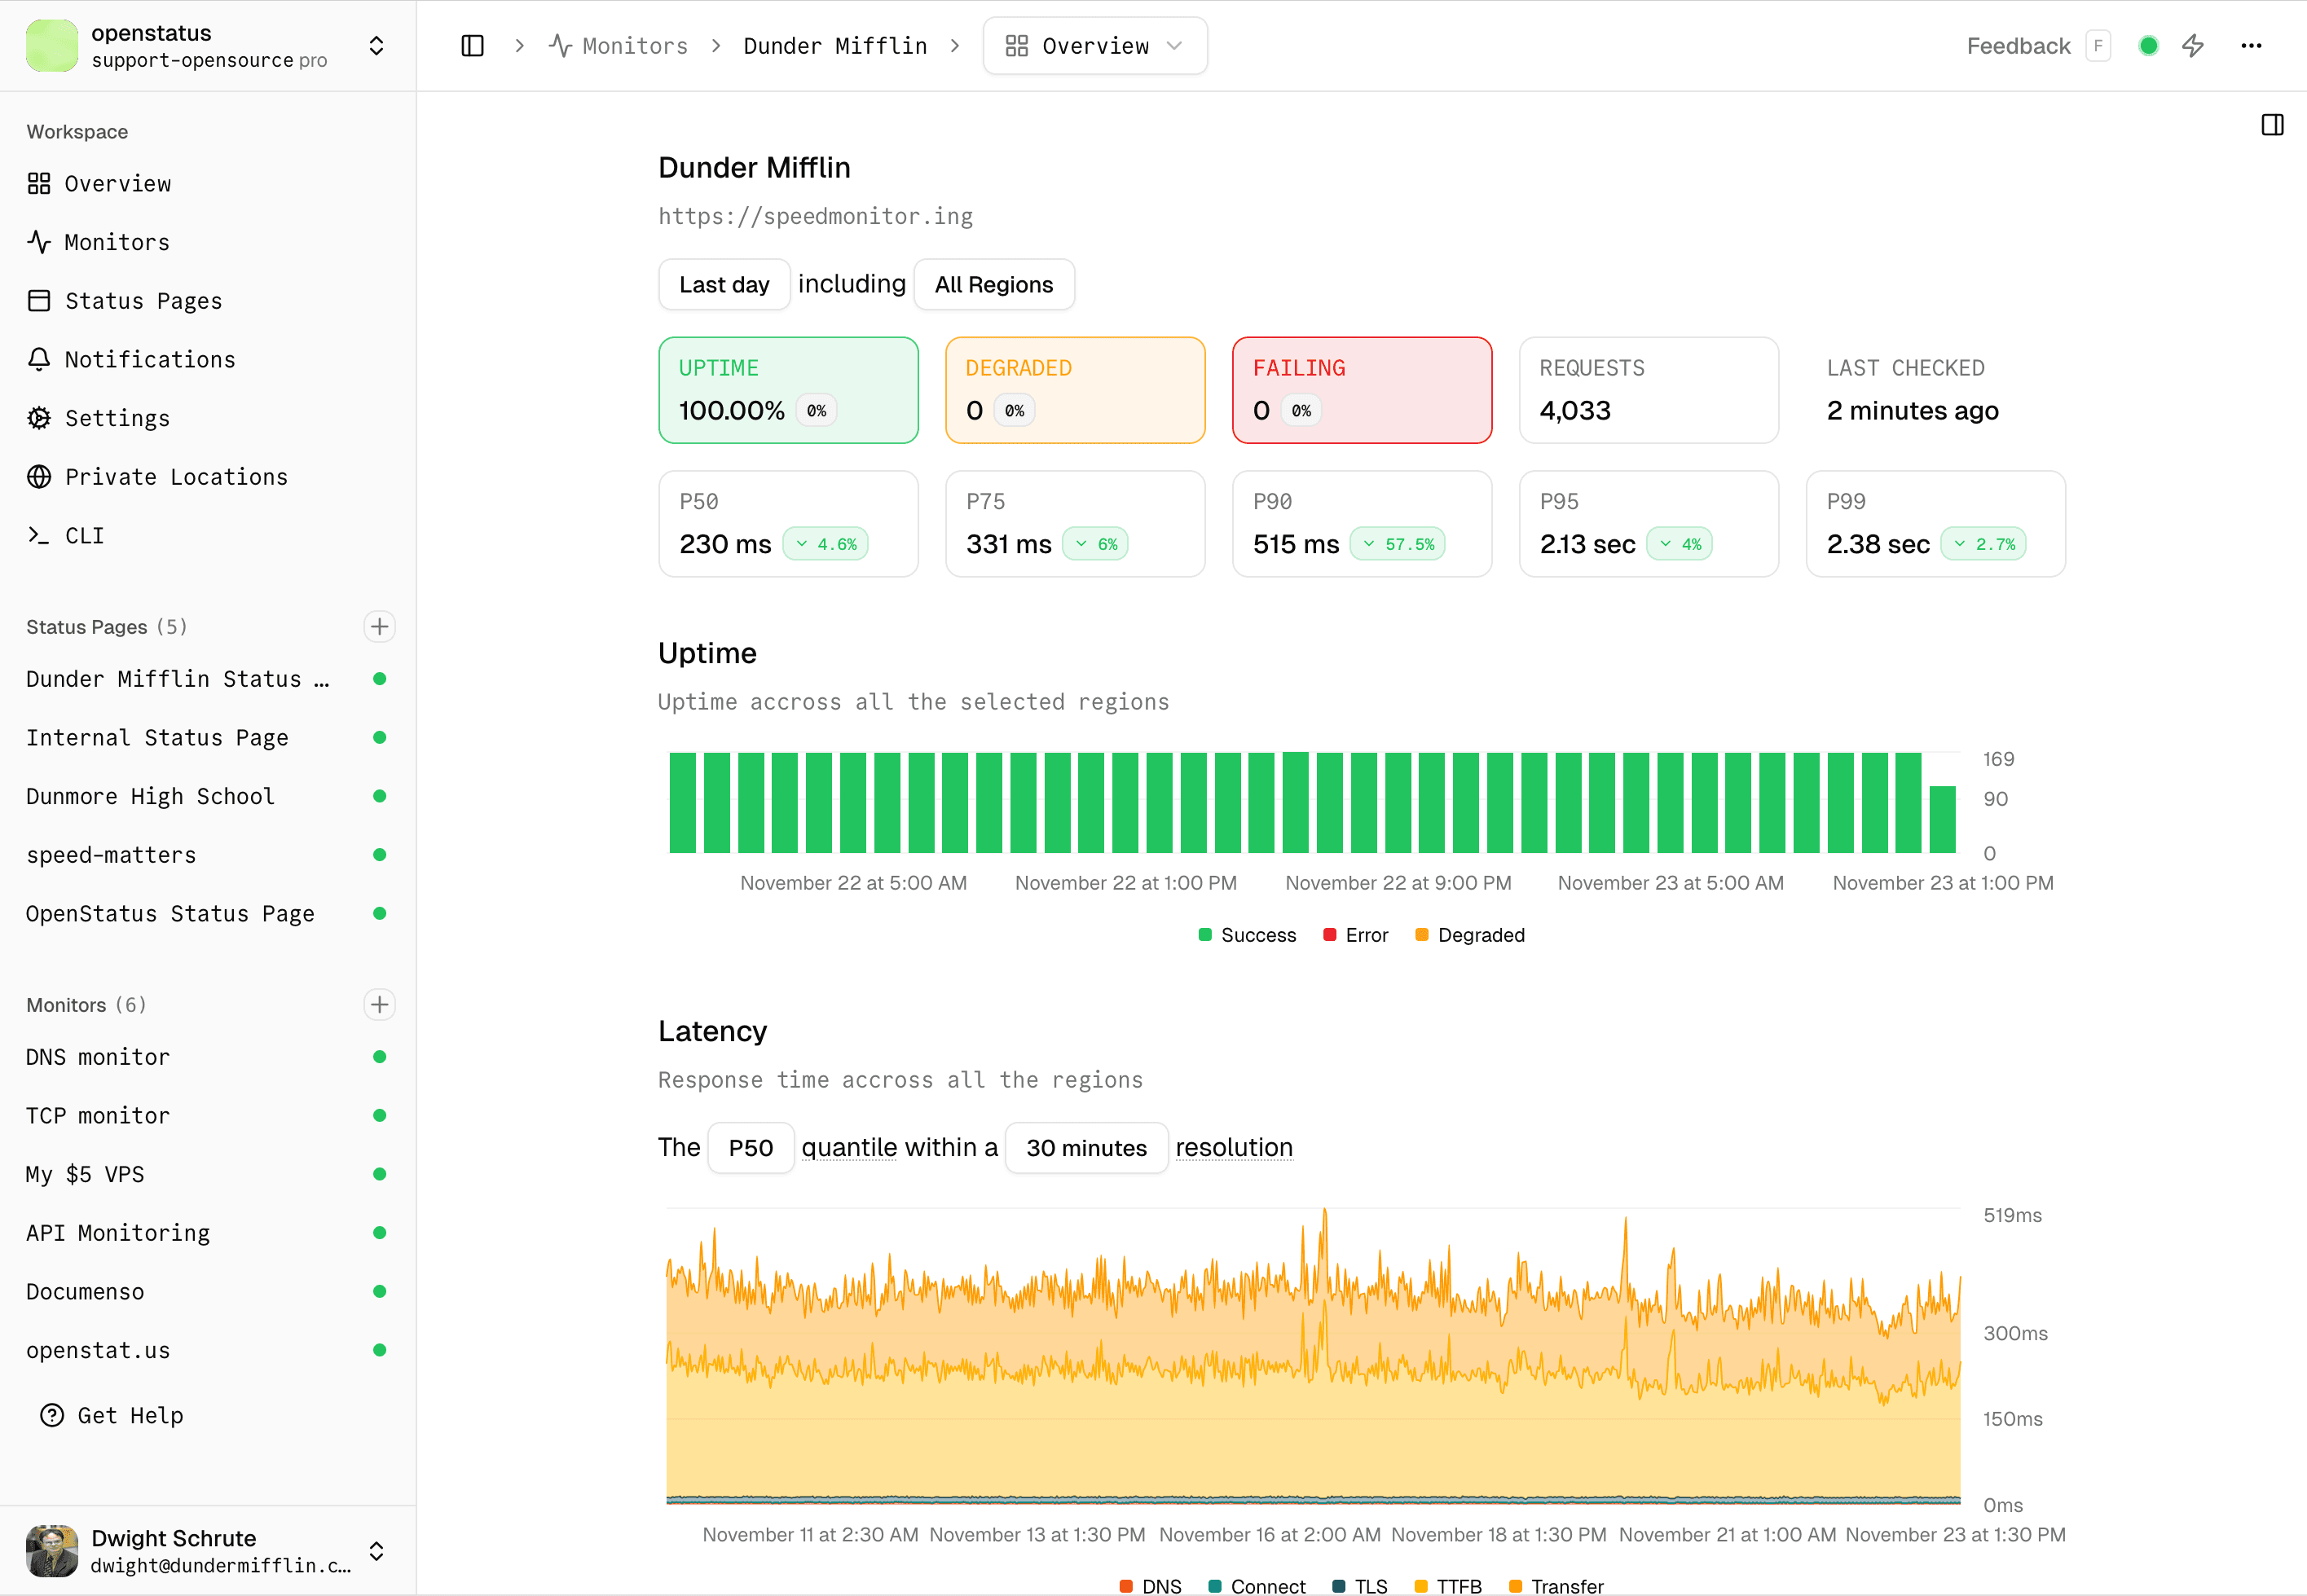
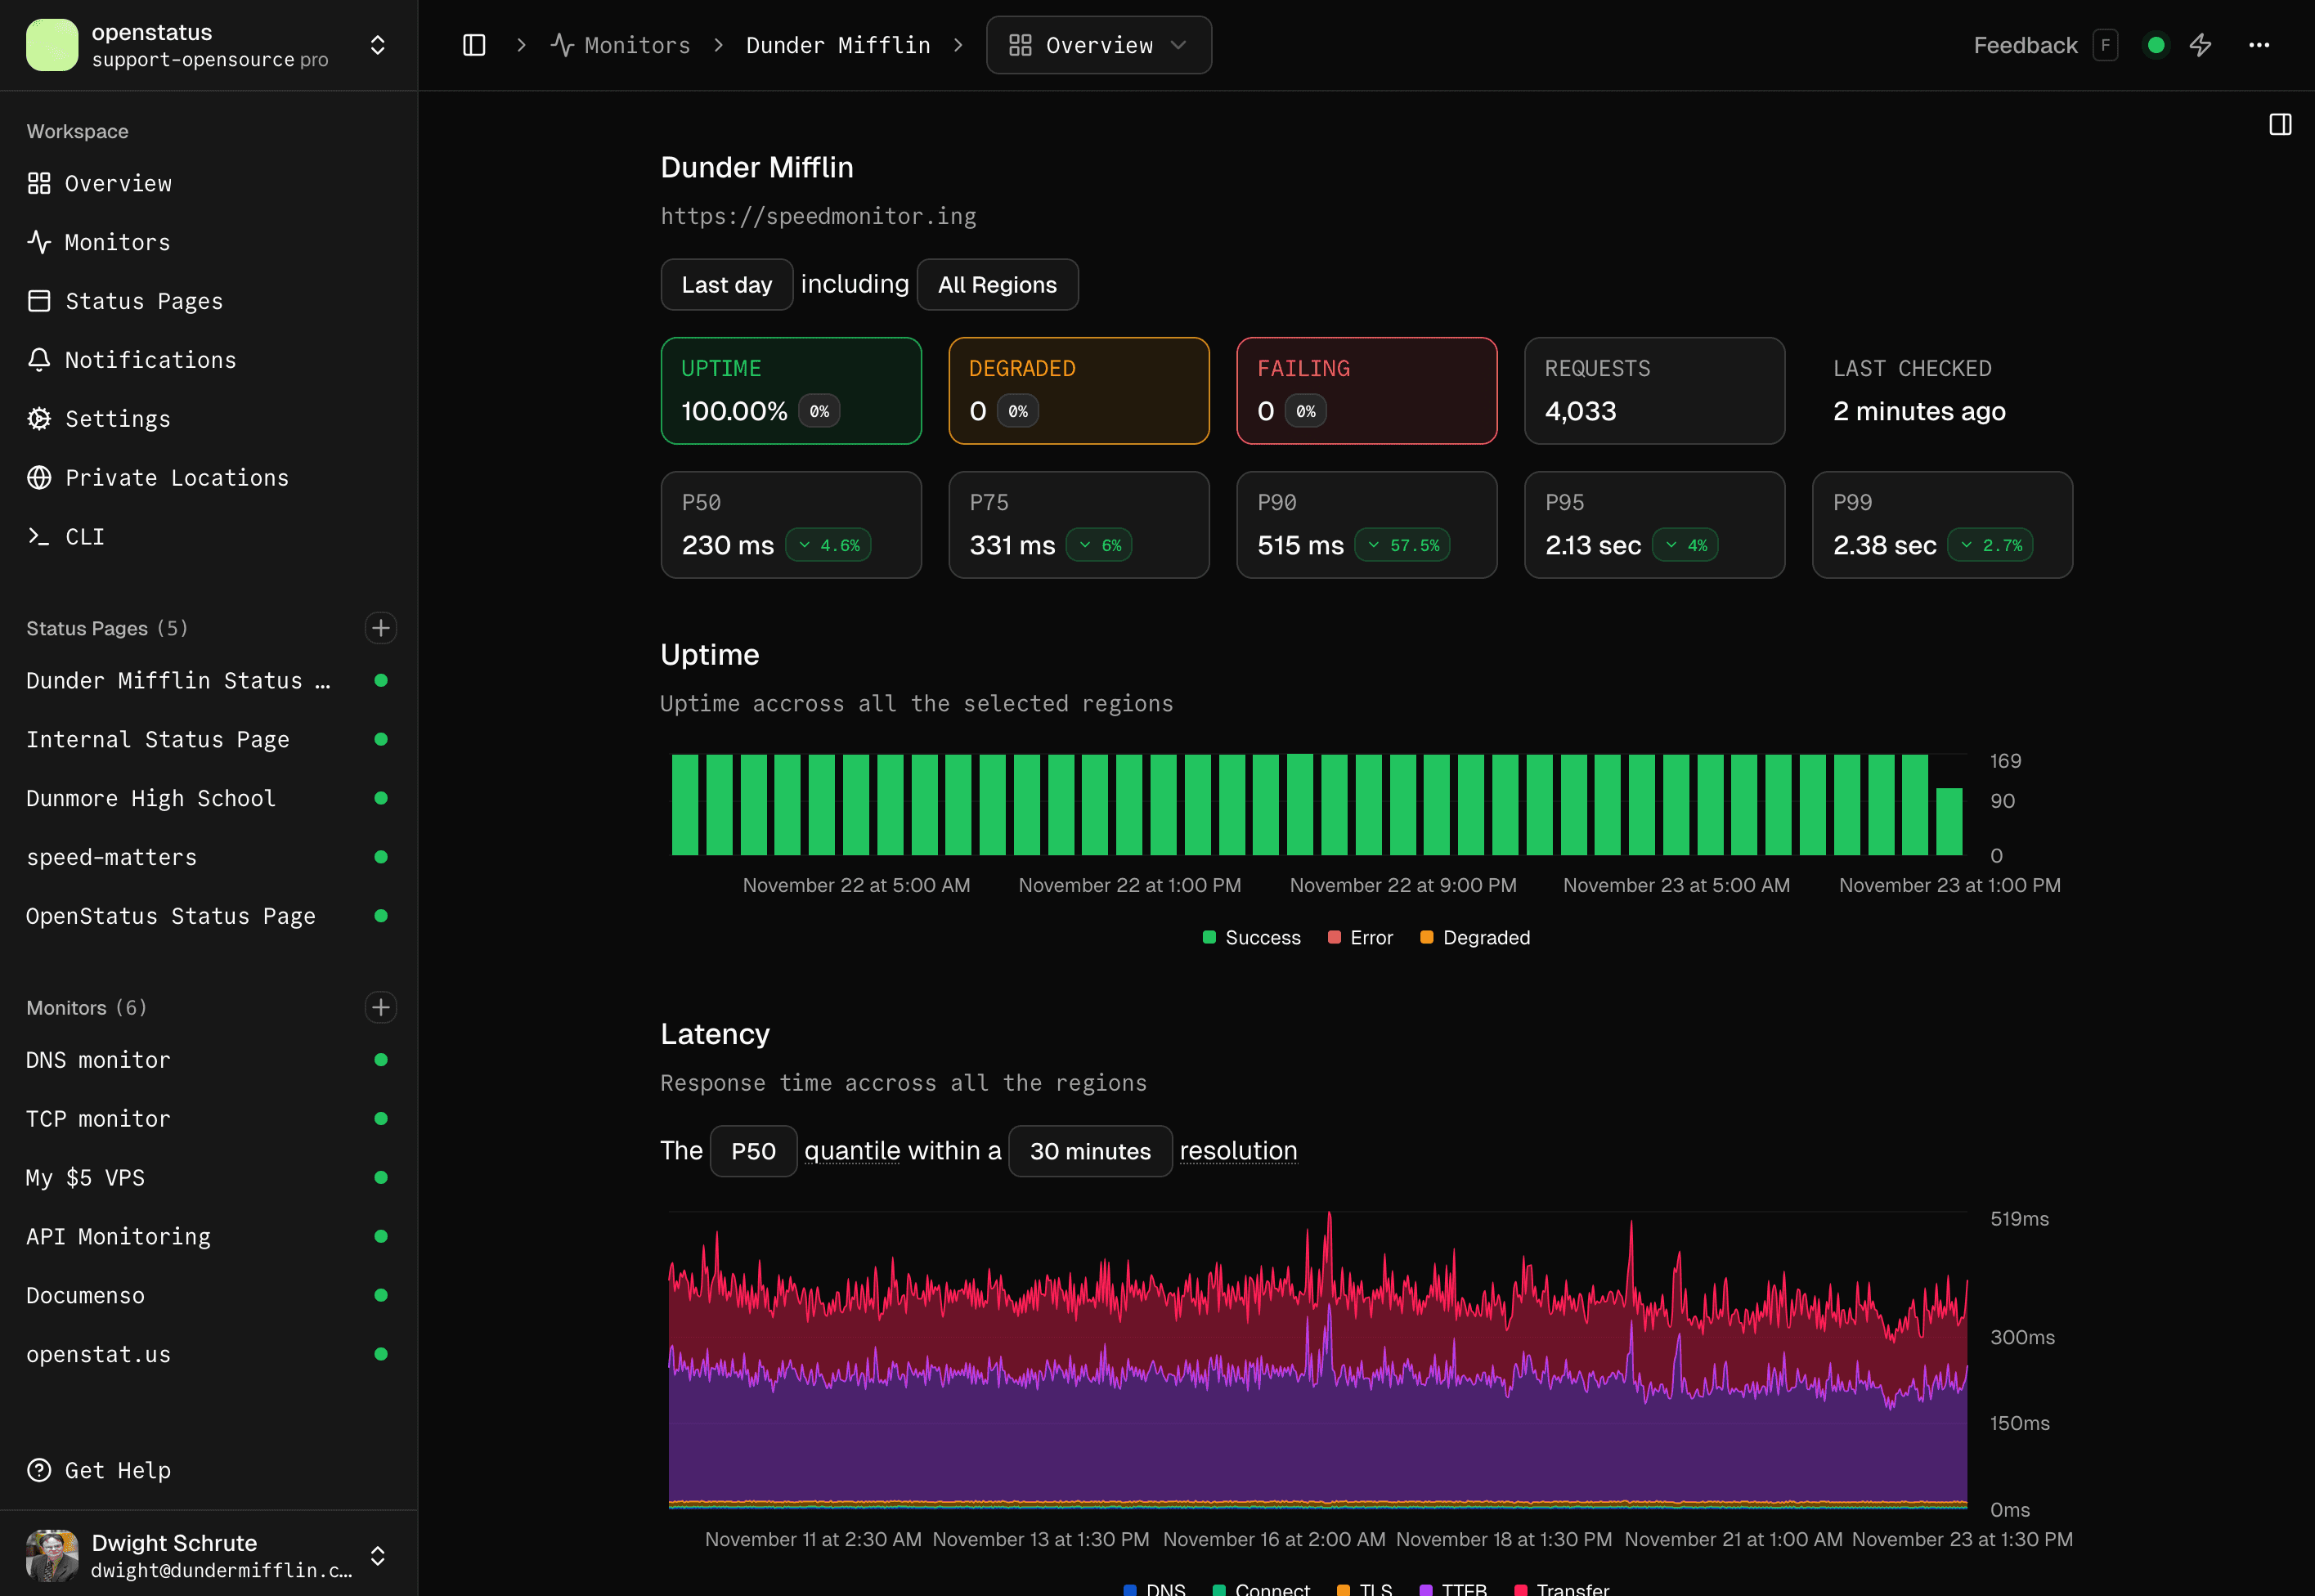
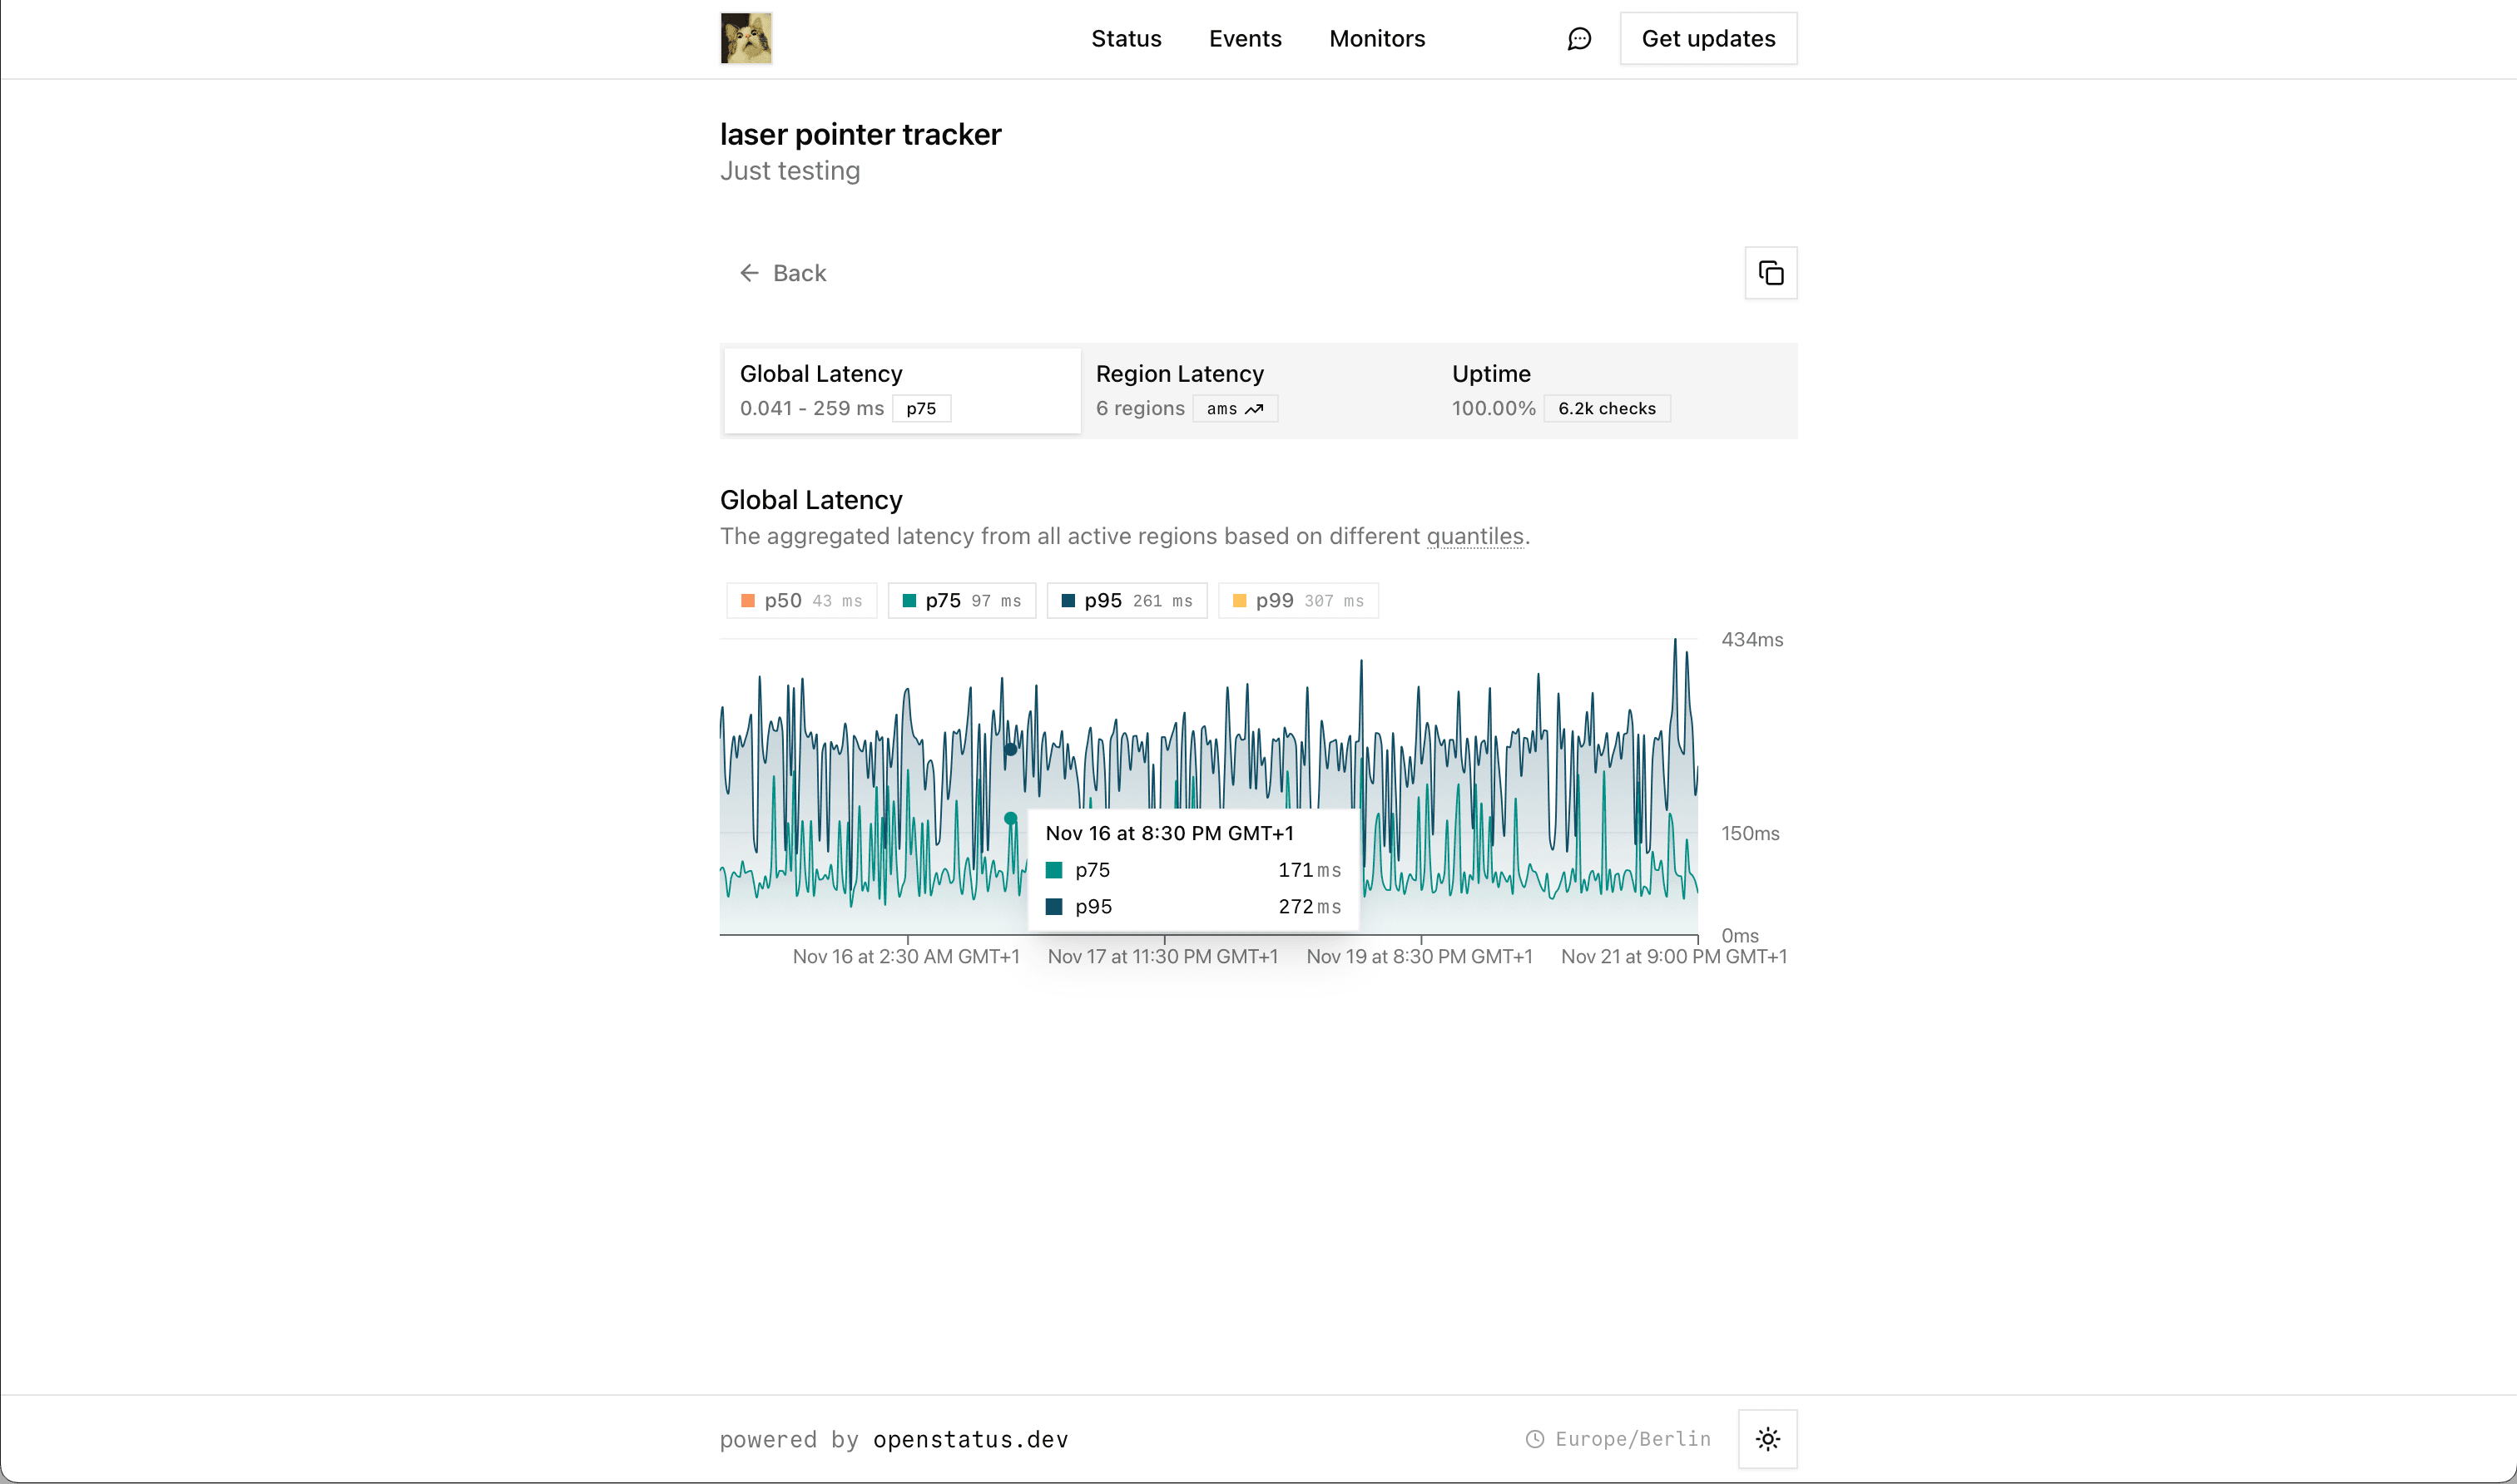
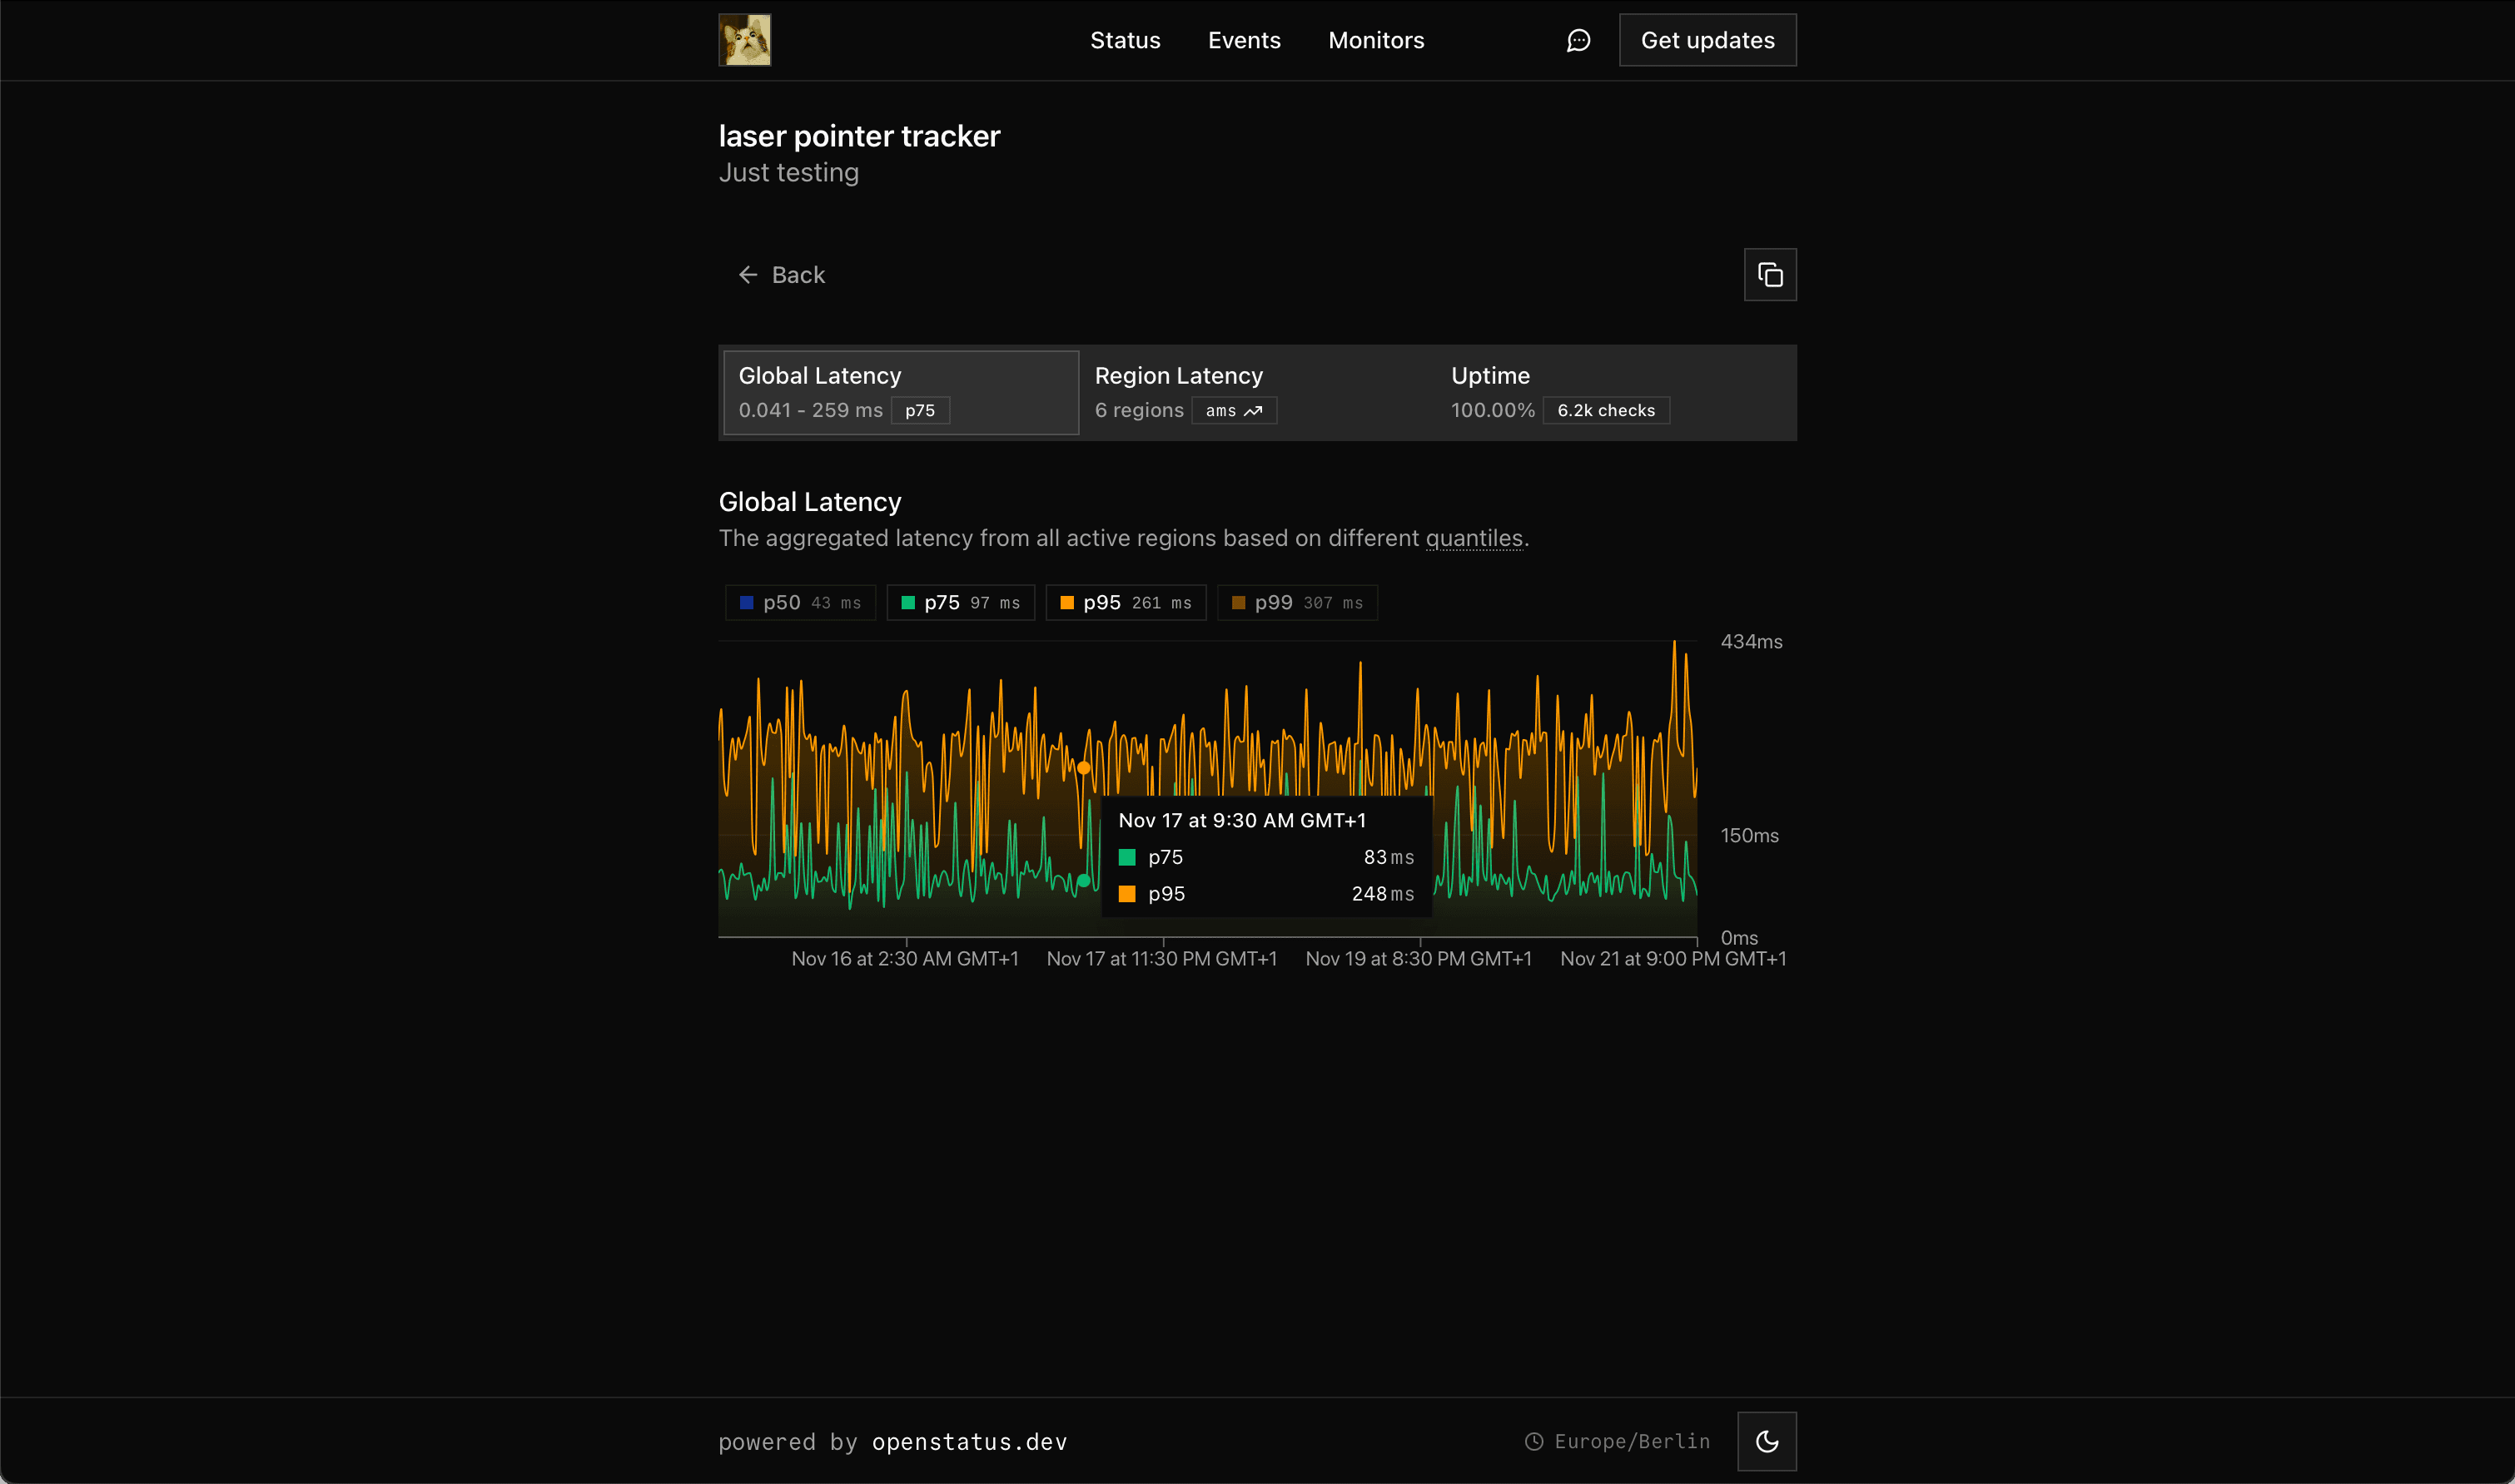
Uptime Dashboard
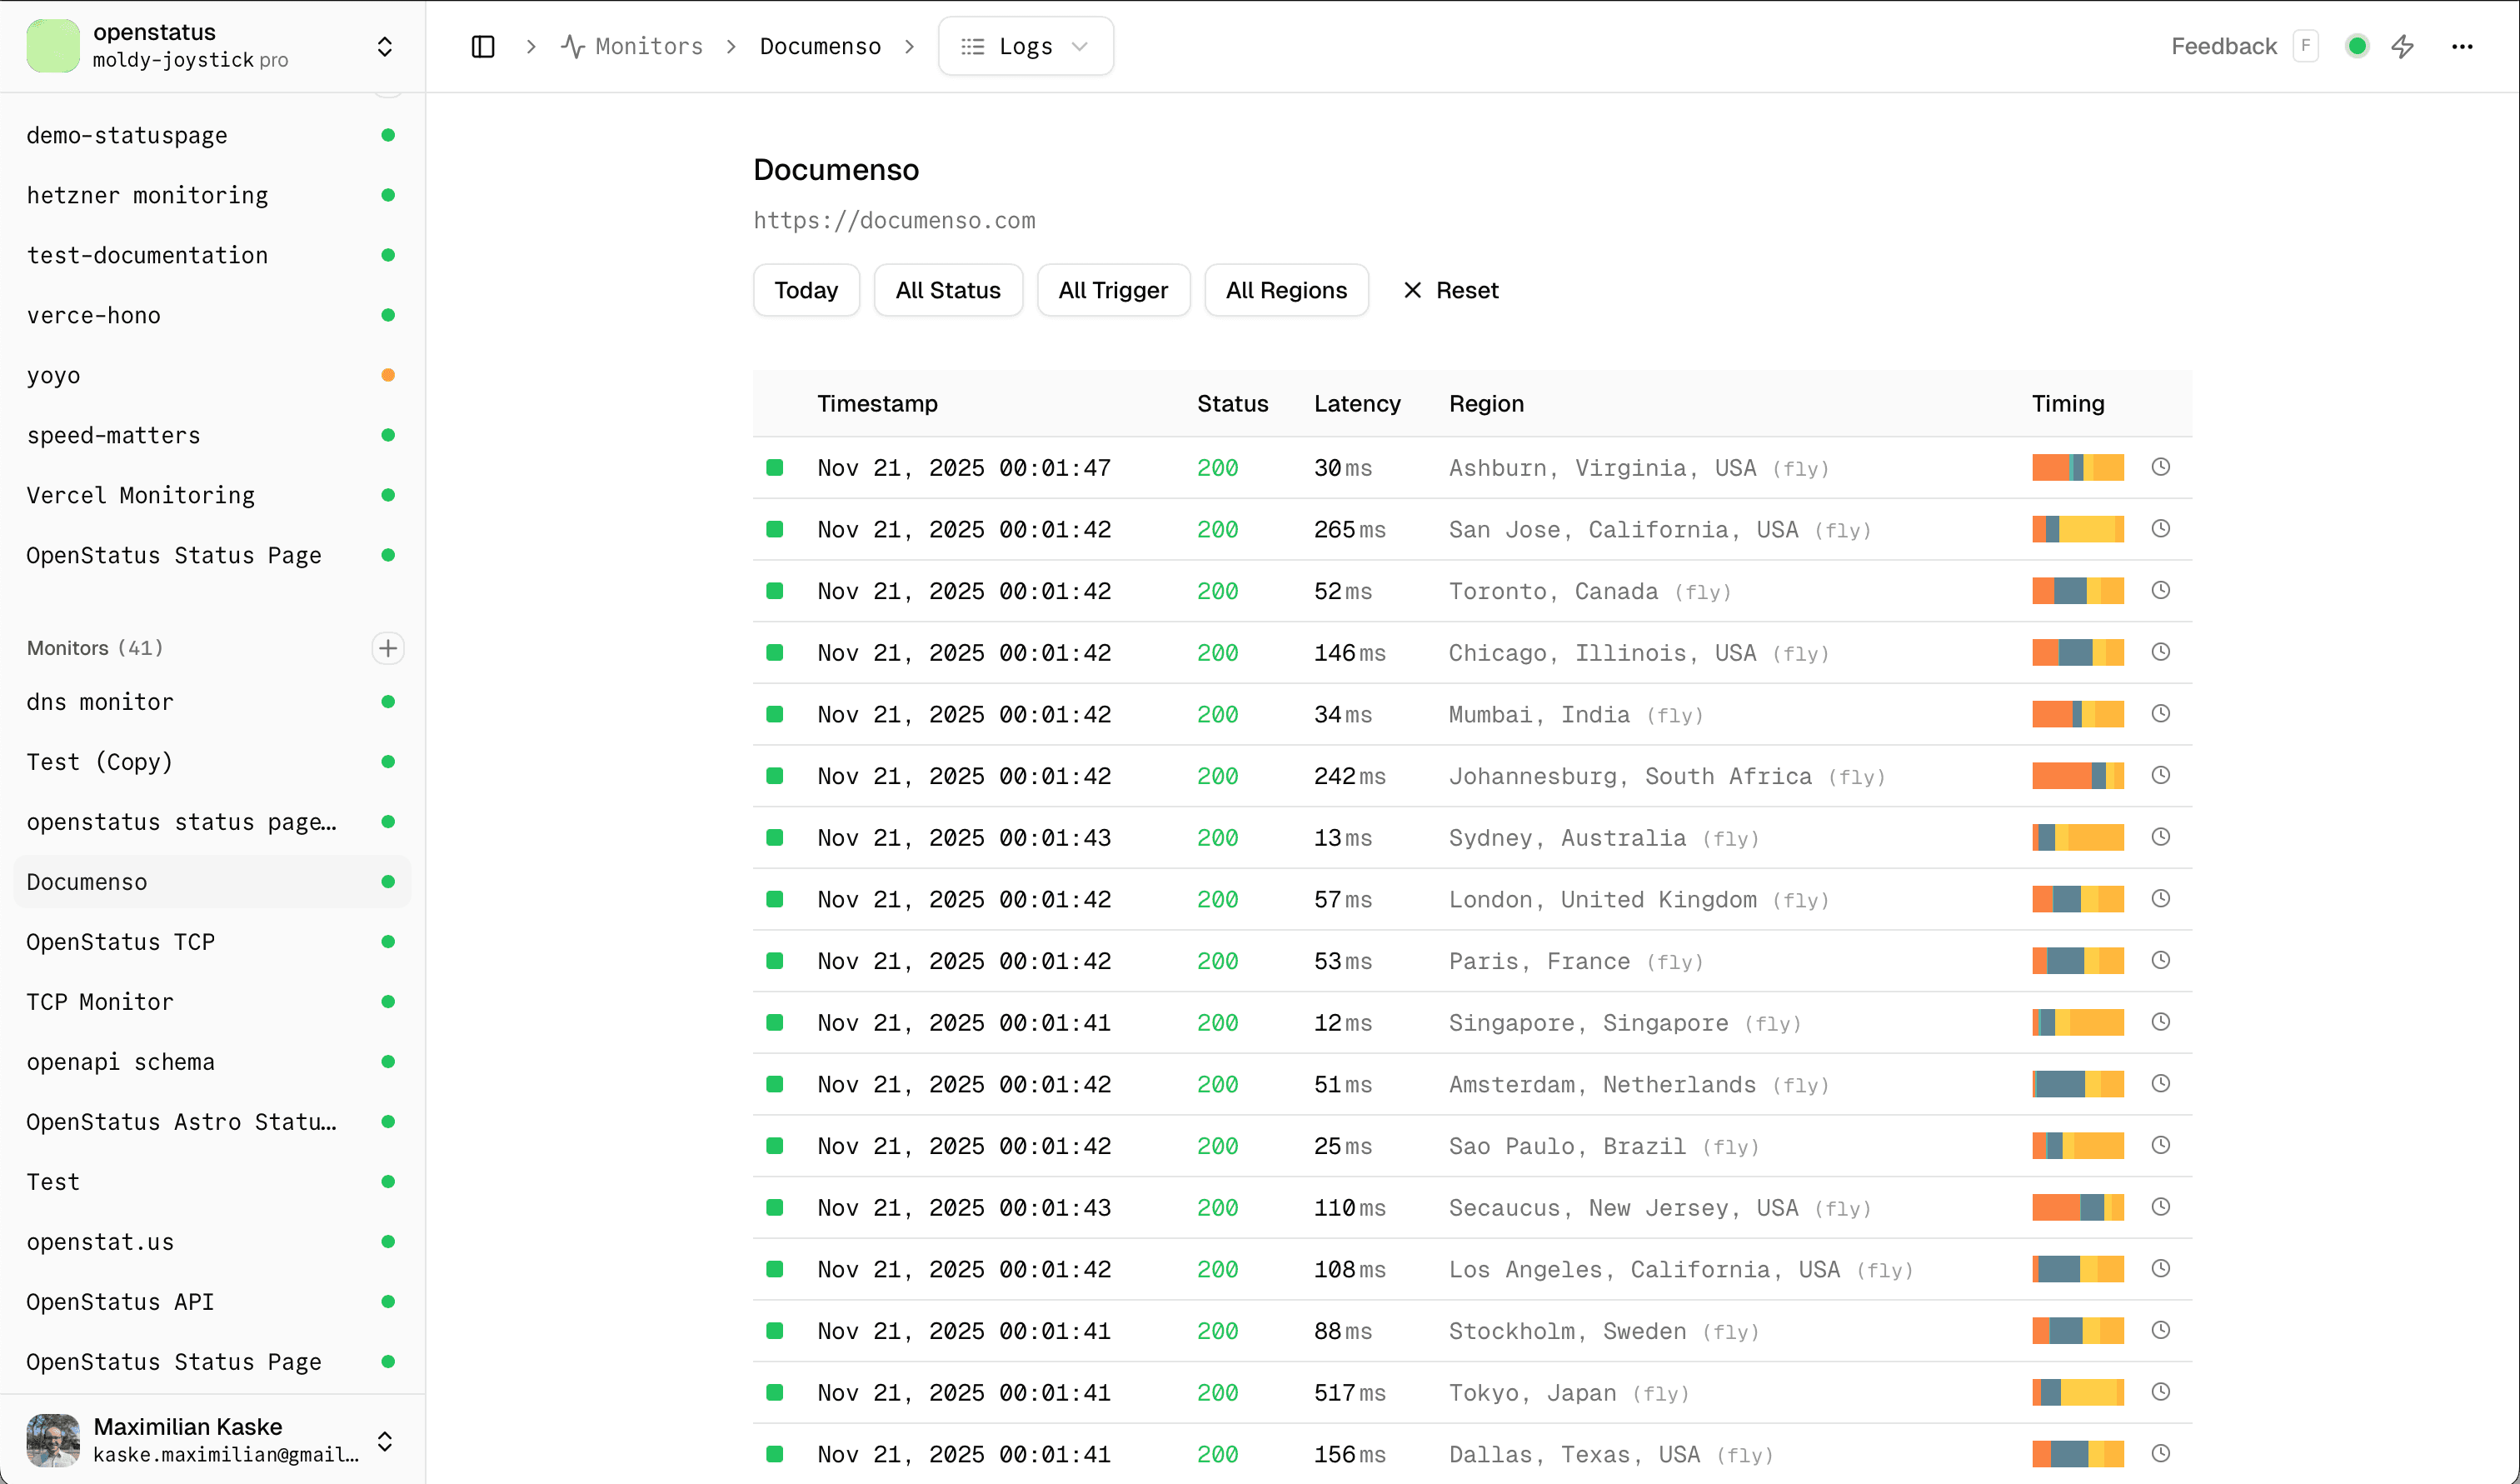
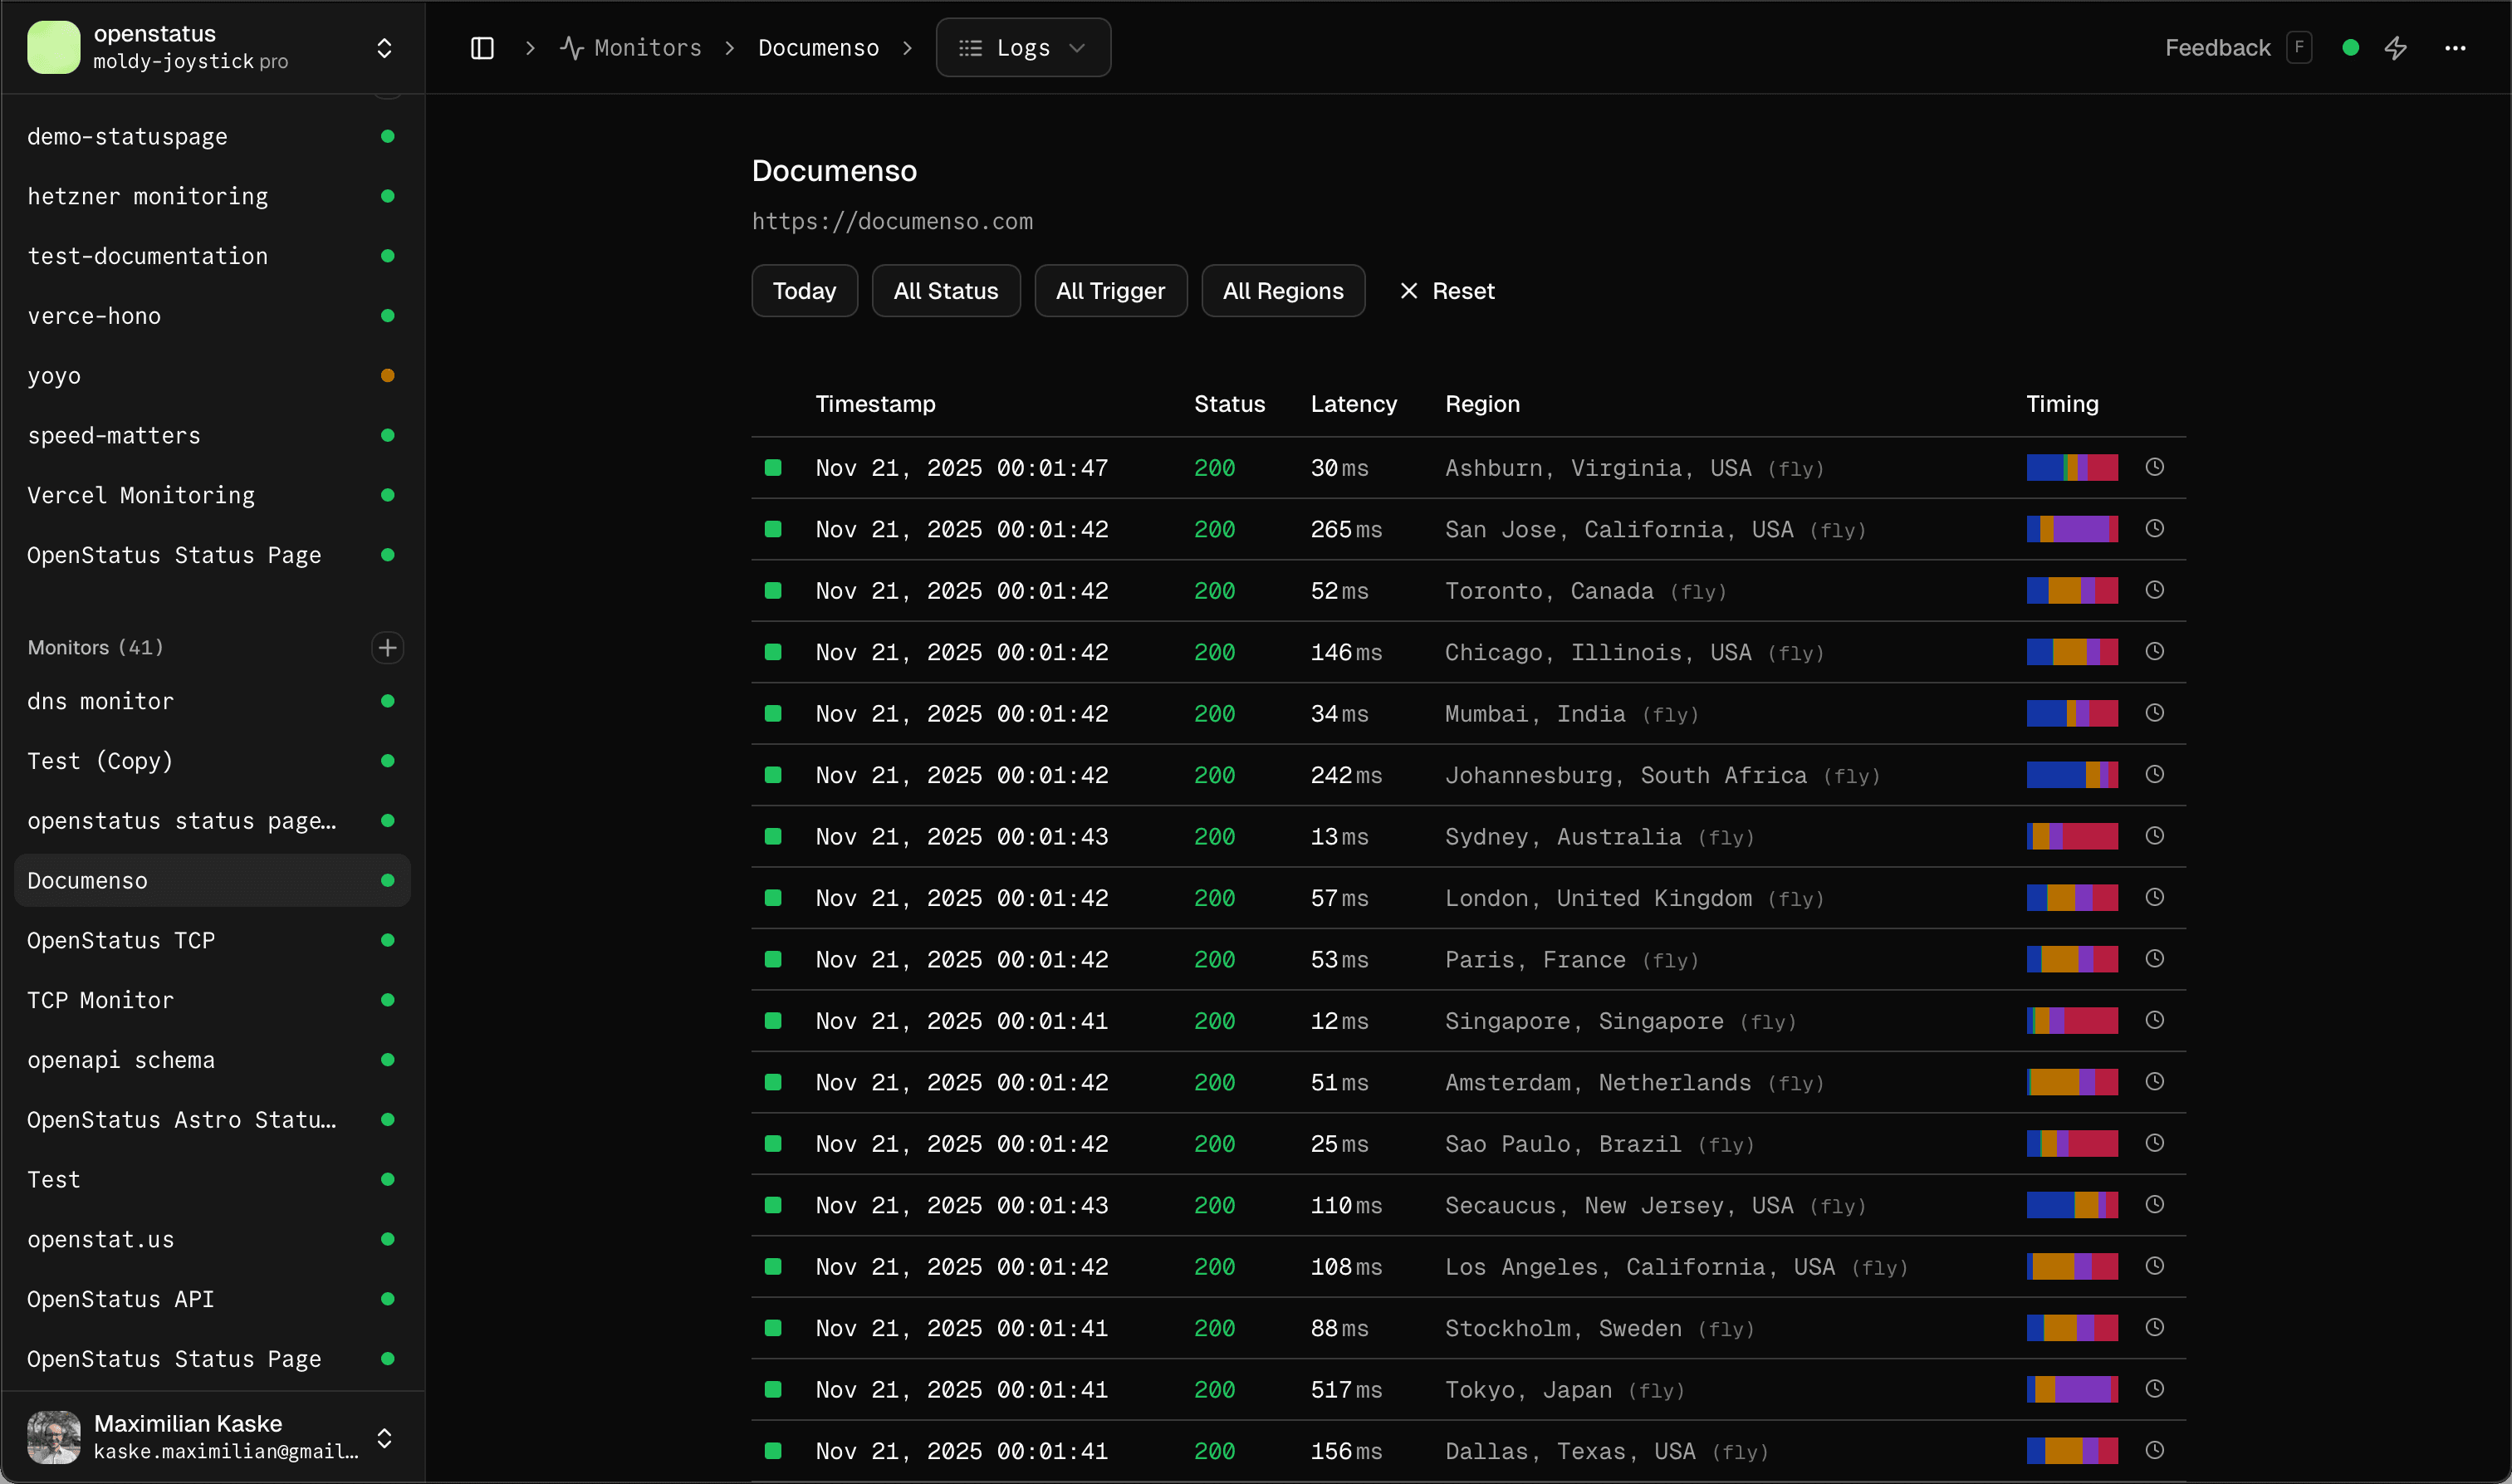
Response Logs
Why choose openstatus for uptime monitoring?
Global Monitoring
You can monitor your services from multiple regions around the world. We currently have our probes deployed in 28 regions.
Check all regions in the global speed checker.
Multi Cloud
You should avoid monitoring your services from the same cloud providers you use for those services. That's why our probes are deployed across three different cloud providers:
- Fly.io
- Koyeb
- Railway
API Monitoring
Monitor any HTTP/HTTPS endpoint including REST APIs, GraphQL APIs, webhooks, and third-party service endpoints. Openstatus supports all HTTP methods and custom headers for authentication.
Assertions
Validating your response can be important. You can do status code, header or body text assertions. Read more in the docs.
Thresholds
You can set a degraded at and timeout threshold whenever required. We will send you a notification whenever the responses exceed the thresholds.
Open Telemetry
When needed, you can export to your OTLP endpoint the metrics for every request we do. Access the data and set yourself an alert channel in Grafana, Honeycomb etc. Read more in our guide.
Notification channels
Set different notification channels and get notified whenever a not satisfying your assertions or are exceeding the thresholds.
We support:
- Socials: Slack, Discord, Telegram Bot
- Direct: Email, SMS
- Incident Management: OpsGenie, PagerDuty
- Custom: Webhook, Ntfy
Status Pages
Automatically update your status page based on your uptime monitoring results. Push reports and communicate with your users during incidents. You can choose to share response details on your status page. Read more about status pages.
Monitoring as Code
The best way to version your monitor changes is via the openstatus CLI and its YAML config. Additionally, we provide a Terraform Provider.
# yaml-language-server: $schema=https://www.openstatus.dev/schema.json
uptime-monitor:
  name: "Graphql"
  description: "GitHub GraphQL API"
  frequency: "10m"
  active: true
  regions:
    - iad
    - ams
    - syd
    - jnb
    - gru
  retry: 3
  kind: http
  request:
    url: https://api.github.com/graphql
    method: POST
    headers:
      User-Agent: OpenStatus
      Authorization: Bearer YOUR_TOKEN_HERE
    body: |
      {
        "query": "query { viewer { login }}"
      }
Once set, apply your changes via CLI:
openstatus monitors apply
Check our GitHub repository to see the YAML templates of how to monitor MCP, GraphQL,... endpoints. We also provide a simple GitHub Action to run it in your CI/CD.
Private Locations
Sometimes the services you want to monitor are not accessible from the outside. Simply deploy our probes to your favorite cloud provider, your own server or on your own virtual private cloud (VPC).
The docker image is only 8.5MB small and should easily fit on your infrastructure whether ARM64 or AMD64.
docker pull ghcr.io/openstatushq/private-location:latest
docker run -d \
  --name openstatus-private-location \
  --restart=always \
  -e OPENSTATUS_KEY=$OPENSTATUS_KEY \
  ghcr.io/openstatushq/private-location:latest
You can read more here:
Status Page Monitors
Check your website's latency
Global Speed Checker