Dashboard Metrics Card
Feb 09, 2024 | by openstatus | [monitoring]
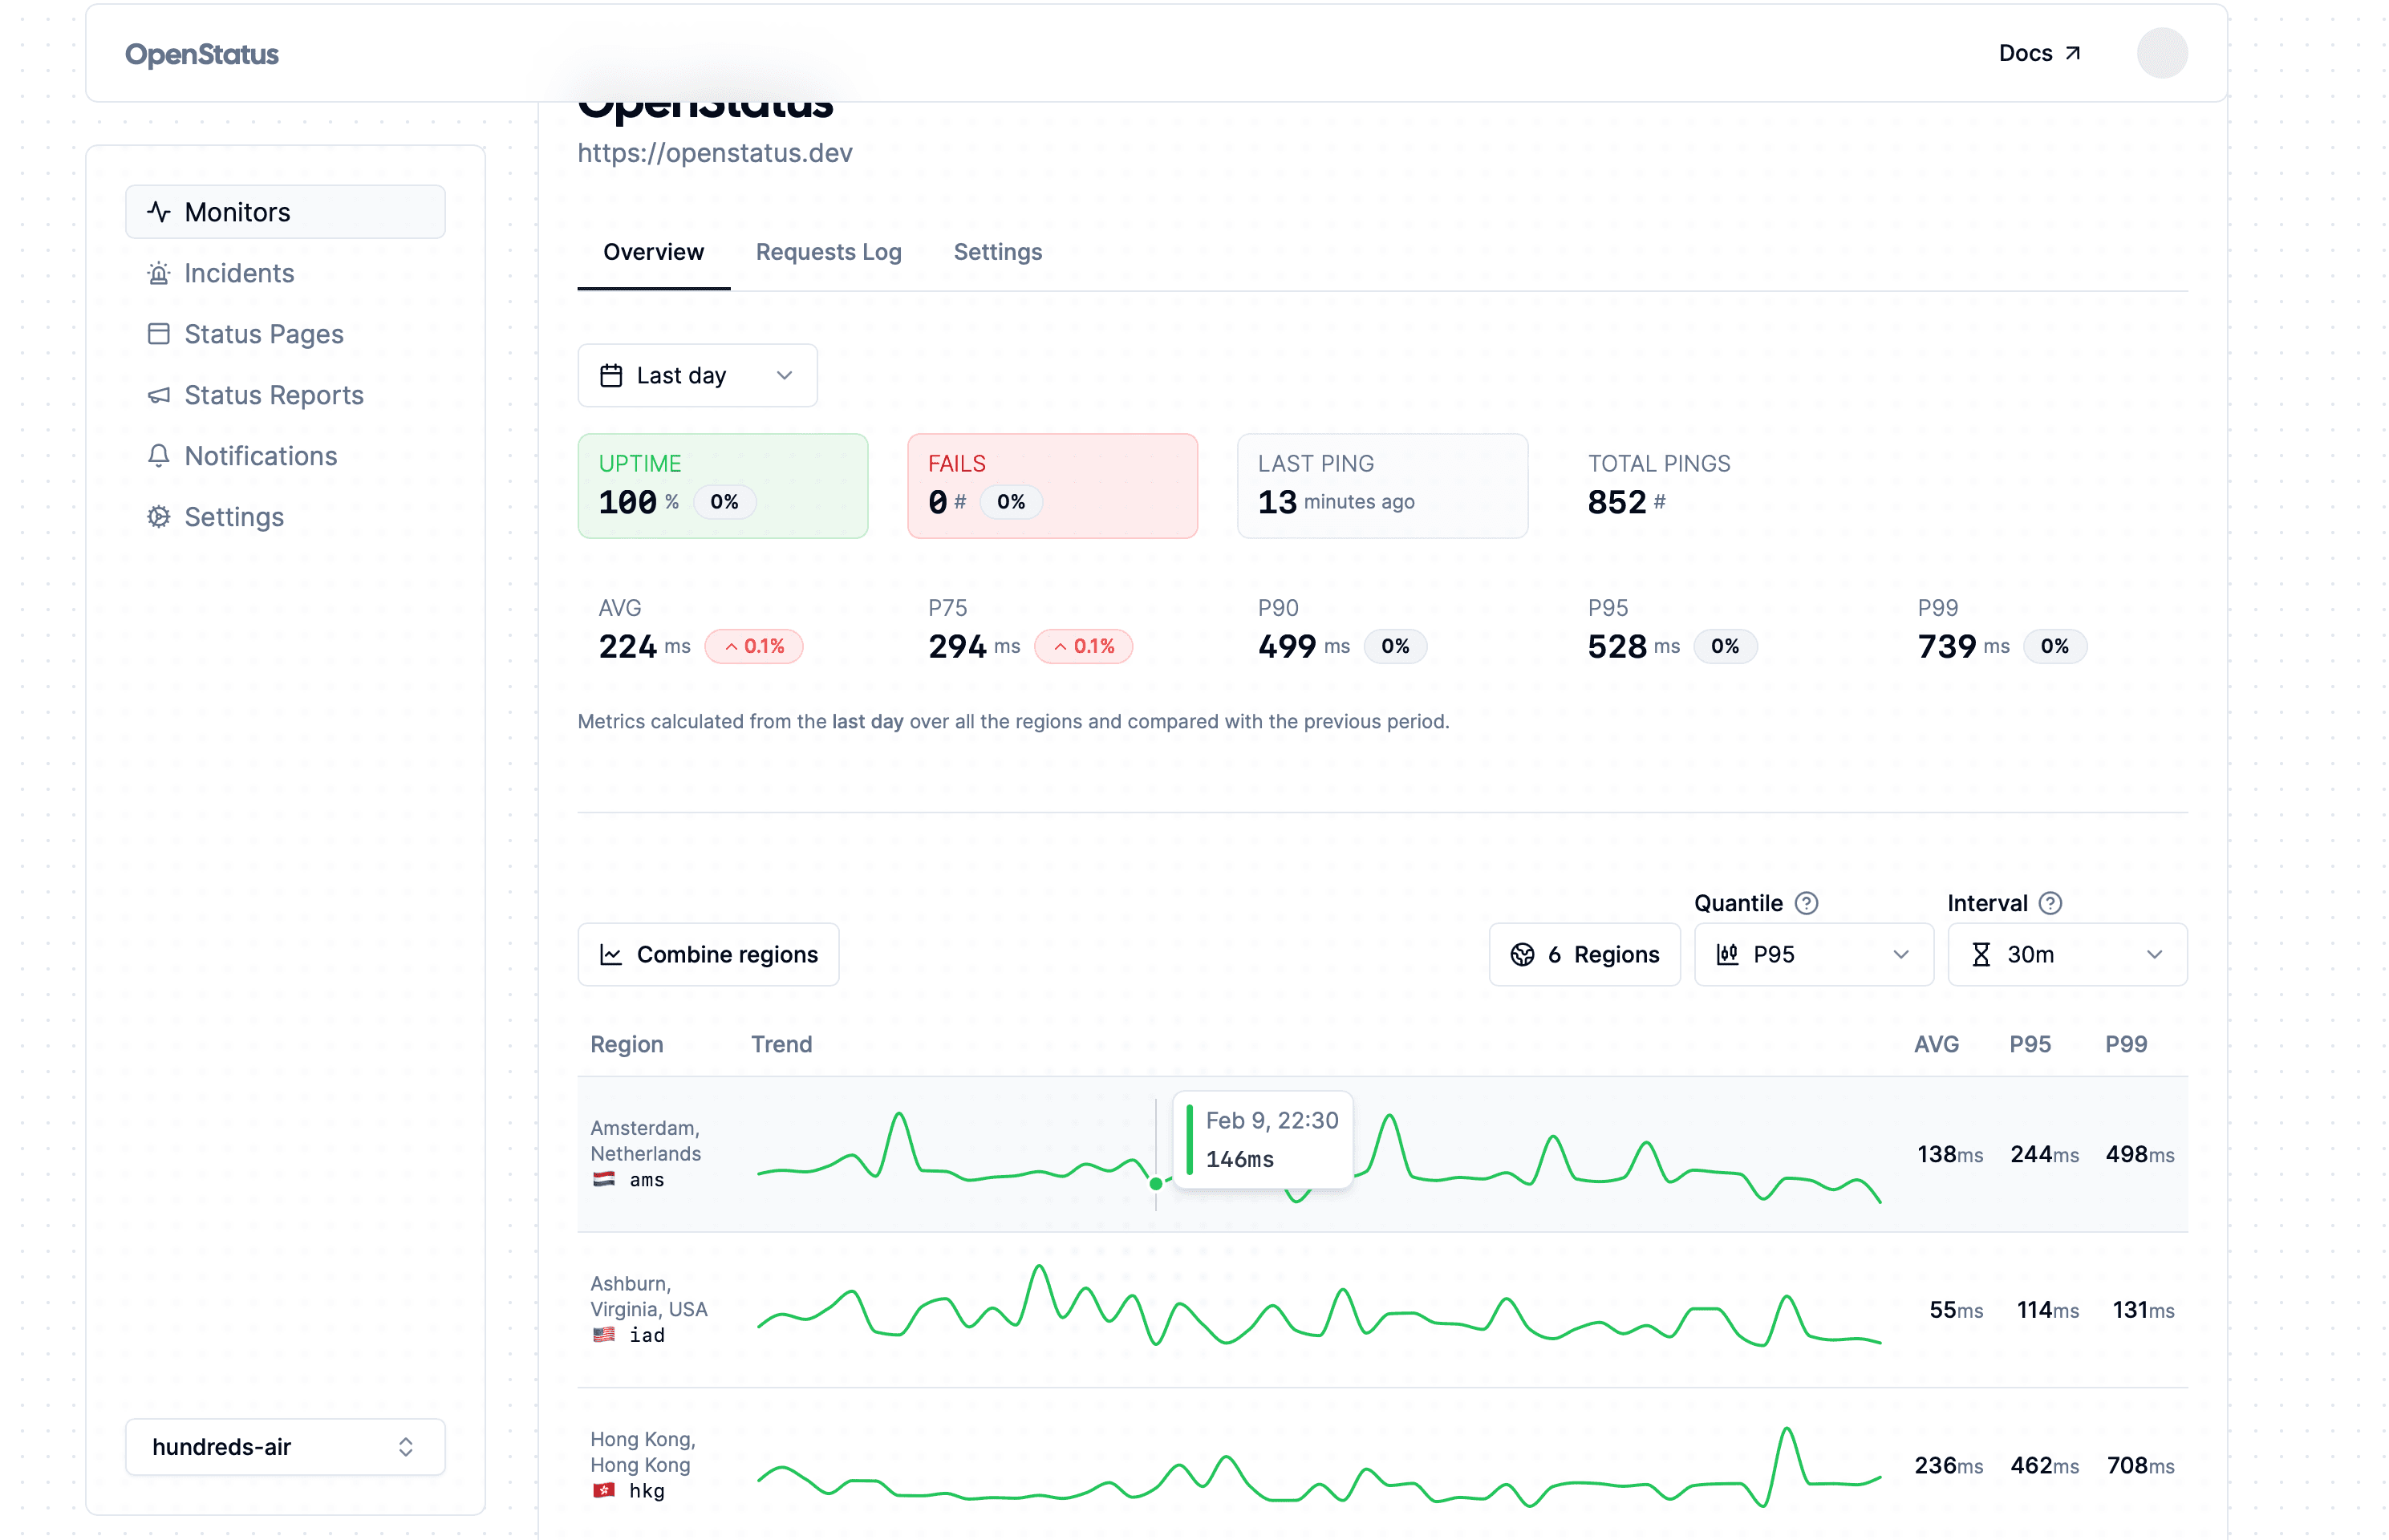
You can now see more insights into your services with the new metrics card on the monitor's overview.
Choose a period and see the: uptime percentage, number of errors, number of total requests, average, p99, p95, p90, and p75 response times - and compare the metrics with the previous period.
You'll also notice that you can now filter the charts by region and combine or split the regions separately for simpler comparison.
Additionally, we've updated the monitor settings section to improve the UI/UX.
So go to your dashboard to check it out!