
Why we migrated from Google Cloud Tasks to Pub/Sub
Nov 05, 2026 | by Thibault Le Ouay Ducasse | [engineering]
openstatus runs about 250M uptime checks a month across 27 regions. Once a minute, a scheduler queues the checks that are due, each one for a specific region. Until recently, that queue was Google Cloud Tasks, which pushed every check to our checkers over HTTP.
We replaced it with Pub/Sub, and the checkers now pull their own work. Our Google Cloud bill went from about 6.80€ a day to about 0.60€, or roughly 200€ to 20€ a month.
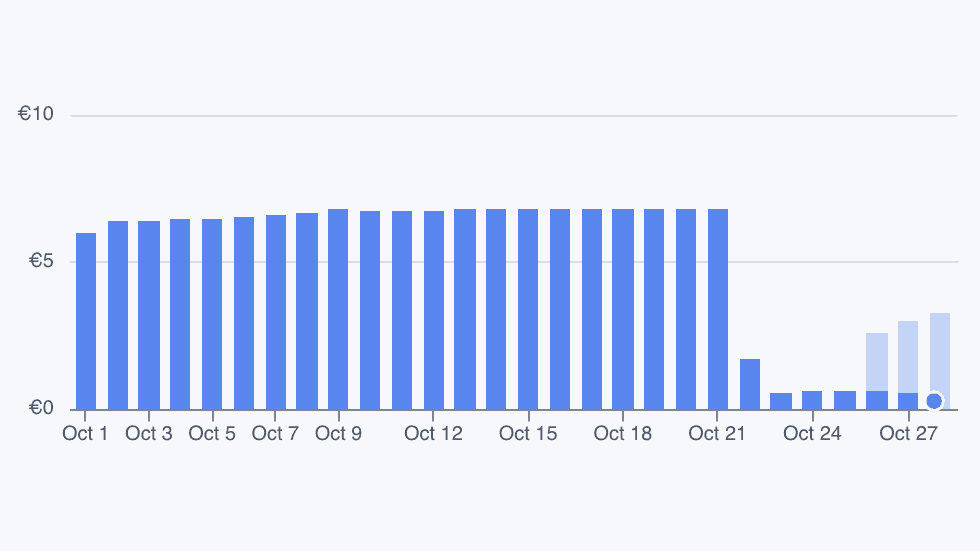
The migration wasn't as smooth as the chart looks. We had to roll back our first attempt after 15 minutes because we were getting rate-limited by Tinybird. Then, a few days later, we noticed our latency numbers had jumped right after the switch.
In both cases, the issue was the same: Cloud Tasks had been smoothing our traffic for us, and we didn't realize how much we relied on it.
Why we were on Cloud Tasks
When we started openstatus, our checkers ran on serverless platforms. We didn't want to miss a check, and a queue that pushes an HTTP request to wake up a function worked well for that. We also had Google startup credits, so it cost us nothing.
Since then, a few things changed:
- Our startup credits ran out, and at ~250M checks a month, Cloud Tasks was getting expensive.
- We rewrote our checker as a Go service running 24/7 on Fly, Koyeb, and Railway. There were no serverless functions left to wake up.
- Pushing checks over HTTP was awkward across multiple clouds. Each task hit a public URL with a region header (
fly-prefer-region,X-KOYEB-REGION-OVERRIDE,railway-region). On Fly, if a request landed on a machine in the wrong region, it had to bounce it withfly-replay. It made much more sense for the machines to just pull their own work.
How we set up Pub/Sub
Topic layout and pricing
Cloud Tasks bills per operation ($0.40 per million). Pub/Sub bills per byte ($40 per TiB after the first 10 GiB), and our messages are small—about 650 bytes each.
Every check needs to run in a specific region. Our first idea was to use a single topic with a filtered subscription per region.
The catch is that Pub/Sub still bills you for messages that a subscription filter drops. Since we run in 27 regions, one topic with 27 filtered subscriptions means paying 27 times for every message: once for the region that runs the check, and 26 times for the regions that ignore it.
Here is what we estimated for the different setups:
| Setup | Estimated monthly cost |
|---|---|
| 1 topic, 27 filtered subscriptions (one per region) | ~$212 |
| 1 topic per region, filtered by periodicity | ~$41 |
1 topic per region, 30s and the rest filtered | ~$17 |
| 2 topics per region, no filters | ~$11 |
We went with 2 topics per region and no filters: checker-<region> and checker-<region>-30s (54 topics in total). Note that these numbers don't include GCP egress, which you still pay when your workers run outside GCP like ours do.
Having separate topics per region is also nice for isolation. If one region goes down or falls behind, its backlog stays in its own subscription and doesn't affect the others.
Handling 30-second checks without delayed delivery
Why have a separate -30s topic if we aren't using filters? Because Pub/Sub doesn't support delayed delivery.
Our scheduler cron runs once a minute. A 30-second monitor needs to run twice per minute: once right away, and once 30 seconds later. With Cloud Tasks, we scheduled the second run using scheduleTime. With Pub/Sub, we publish both messages at the start of the minute, put a cronTimestamp 30 seconds in the future on the second one, and let the checker sleep until it's time to run.
If those sleeping messages shared a subscription with the 1m, 5m, and 10m checks, they would sit in MaxOutstandingMessages and block checks that need to run immediately. Giving 30s its own topic lets us buffer up to 2,000 sleeping messages in memory while still capping active checks at 200 at a time. A message only takes one of the 200 slots after it wakes up.
Acks, retries, and dead-lettering
From the queue's perspective, a check that fails because the target website is down is still a processed message, so we ack it. We only nack if we fail to save the result (for example, if Tinybird is down), and we ack and log messages that can never succeed, like invalid JSON. After 5 failed attempts, the message goes to a dead-letter topic.
Pub/Sub delivery is at-least-once and we don't deduplicate on the consumer side, so if a machine crashes mid-check we might record the same check twice. For uptime monitoring, an extra data point is fine compared to dropping a check.
Shipping the migration
I used Claude Code a lot for this migration. It walked me through 17 design questions up front, and we split the work into four PRs so we could deploy each piece behind a flag:
- #2962 moves the check logic out of the HTTP handlers.
- #2963 adds the Pub/Sub consumer behind
PUBSUB_ENABLED. - #2964 adds the publisher behind
CHECKER_TRANSPORT. - #2965 removes the Cloud Tasks code (still in draft until we've been on Pub/Sub for two weeks).
Before switching the flag over, we ran a small script that checked every subscription had an active pull connection, sent one test check to all 54 topics, and waited for all 54 rows to show up in Tinybird. Everything passed, so we flipped CHECKER_TRANSPORT=pubsub.
Writing all of this by hand would have taken us weeks. With Claude Code, we agreed on the plan on October 21 and had it running in production on October 22.
Issue 1: hitting Tinybird's rate limit
Before the migration, each checker sent its result directly to Tinybird—one HTTP POST per check. On Cloud Tasks, our ~5,700 checks per minute were spread out across the whole minute, which came out to about 95 requests per second to Tinybird. Tinybird's Events API has a hard limit of 100 requests per second per workspace, regardless of how many rows you send in a request. We had been sitting right below that limit without knowing it.
When we switched to Pub/Sub, all checkers pulled their batch at the start of the minute and ran at the same cronTimestamp. Instead of ~95 requests per second spread across the minute, we sent thousands of single-row writes in the first few seconds. Tinybird started returning 429s—about 1,400 of them in 90 seconds.
Our retry logic made it worse. When a write to Tinybird failed, the checker nacked the Pub/Sub message. Pub/Sub then redelivered the message, which ran the entire HTTP check again and tried to write to Tinybird again. Within 10 minutes, nacks went from 942 to ~12,000 per minute, and p99 ack latency hit 120 seconds.
We flipped the flag back to Cloud Tasks to stop the bleeding. Checks kept running the whole time and nothing hit the dead-letter topic. Our verification script hadn't caught this because sending one test check per topic only tests that the pipeline is connected, not how it behaves under load.
To fix it (#2974), we added a batcher in the checker that implements our existing Tinybird Client interface:
- It buffers rows in memory per data source and flushes every 2 seconds (plus up to 1 second of random jitter), or when the buffer hits 5 MB.
SendEventwaits until its batch is flushed before returning, so we still don't ack a Pub/Sub message until the row is written to Tinybird.- If Tinybird returns a
429or5xx, the batcher retries the write for up to 30 seconds (respectingRetry-After) without re-running the check itself.
That dropped our Tinybird traffic from thousands of single-row requests at the top of the minute to 17–50 batched requests per second across all regions. We deployed the fix and flipped the flag back to Pub/Sub the same afternoon.
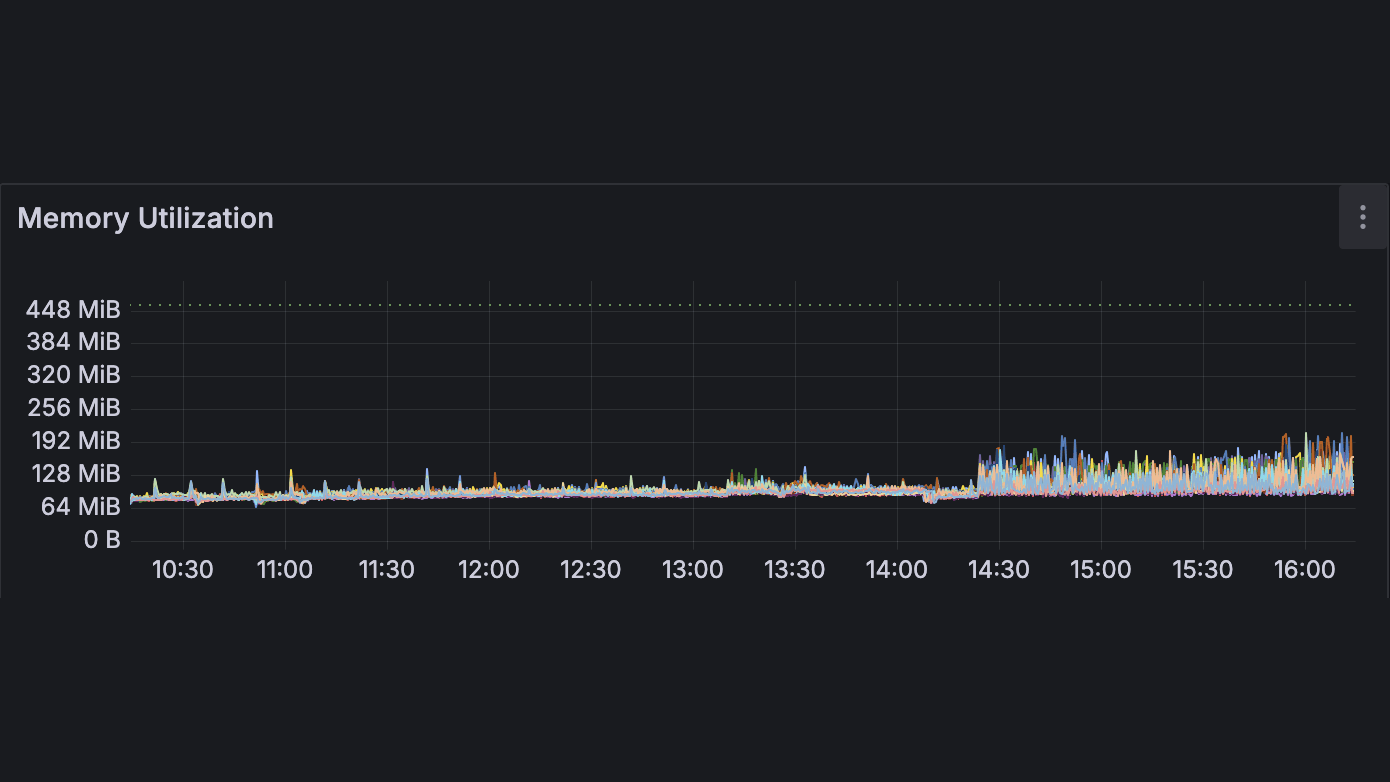
Moving to batched publishing also reduced load on our workflows scheduler service. Instead of making one Cloud Tasks API call per check, it now publishes messages in batches of up to 1,000. On the charts below, 13:10 is the first 15-minute attempt, and 14:25 is the second switch:
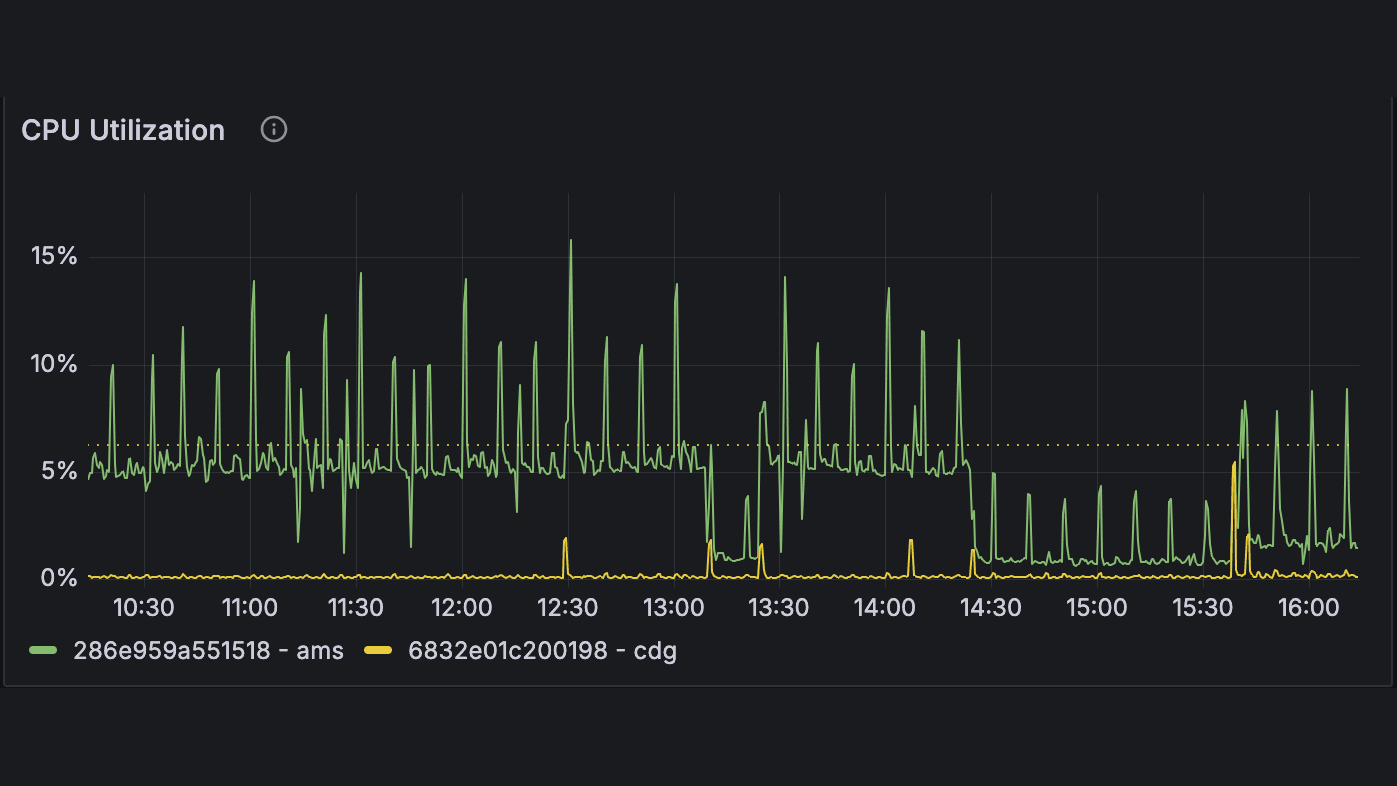
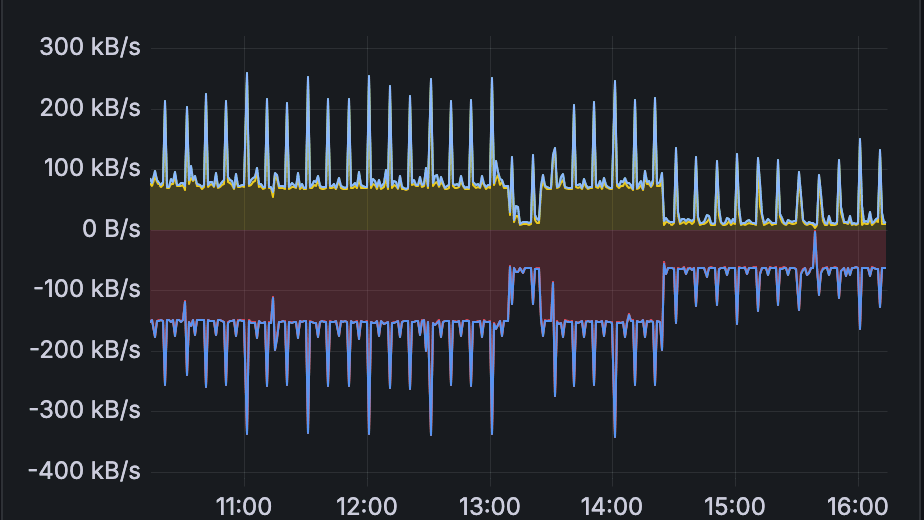
CPU on the scheduler dropped from ~5% to ~1%. Inbound network traffic went from ~75 kB/s to ~10 kB/s, and outbound from ~150 kB/s to ~65 kB/s.
On the checker machines, you can see the move from incoming HTTP requests to pulling from Pub/Sub:
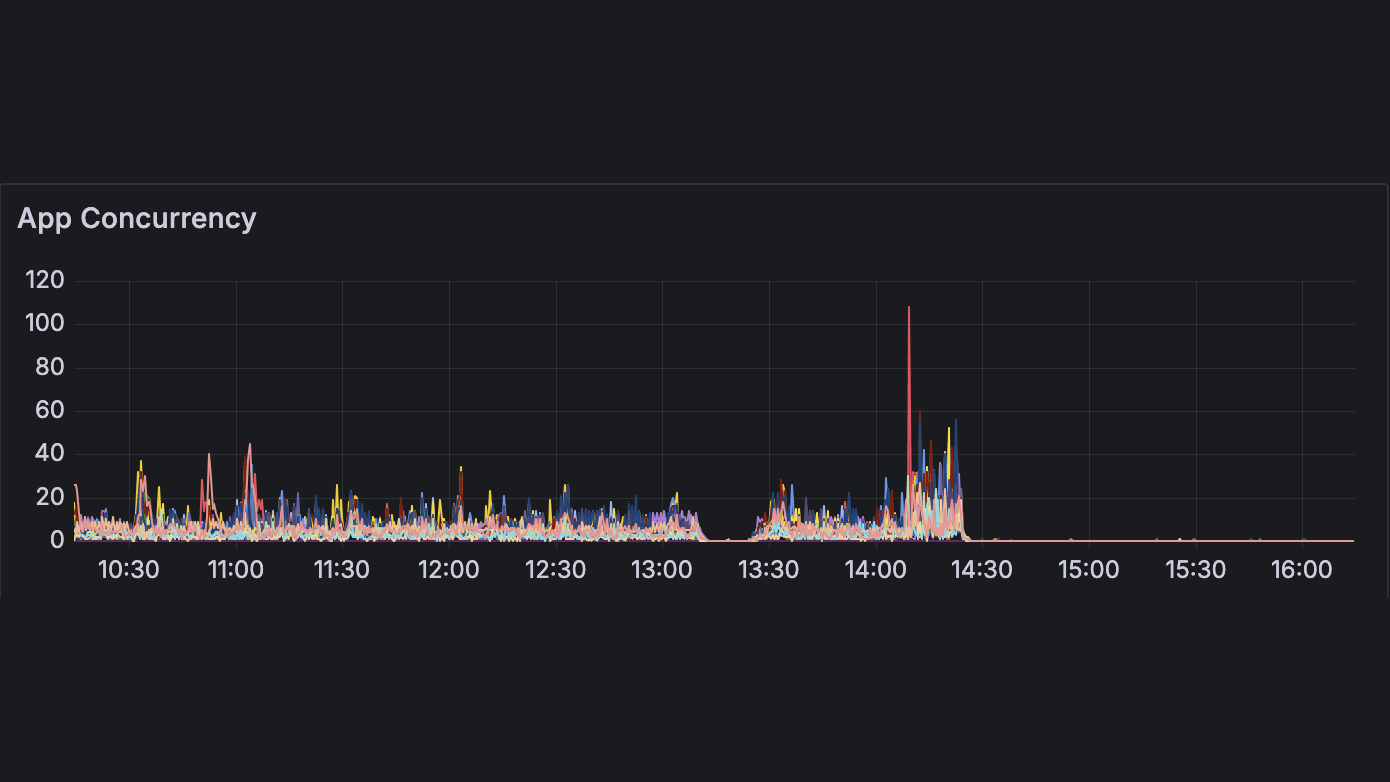
Fly's concurrency metric tracks incoming HTTP requests through its proxy. It dropped to nearly zero because checks aren't pushed over HTTP anymore (the small spikes left are on-demand checks triggered from the dashboard).
Memory went up from a flat ~90 MiB to between 90 and 190 MiB per machine, since each checker now holds sleeping 30s messages and buffers Tinybird rows in memory for a couple of seconds before flushing. That's still well below the 450 MiB limit on those machines.
Issue 2: skewing our own latency measurements
Five days after the migration, we noticed a second problem that was much more annoying for a monitoring tool: our reported response times had gone up.
Cloud Tasks had a queue dispatch limit of 500 tasks per periodicity across all regions, which capped how many checks could start at the exact same moment. With Pub/Sub, every check for a given minute shared the same cronTimestamp, so a single checker machine could start up to 400 checks at the exact same millisecond.
Running hundreds of checks at once on a small VM caused their DNS lookups, TCP connections, and TLS handshakes to contend with each other. We were measuring latency that our own machines were creating.
Here is the P50 latency of one monitor over two weeks. You can see the jump on October 22 when we switched to Pub/Sub, and the drop back to normal on October 27 when we fixed it:
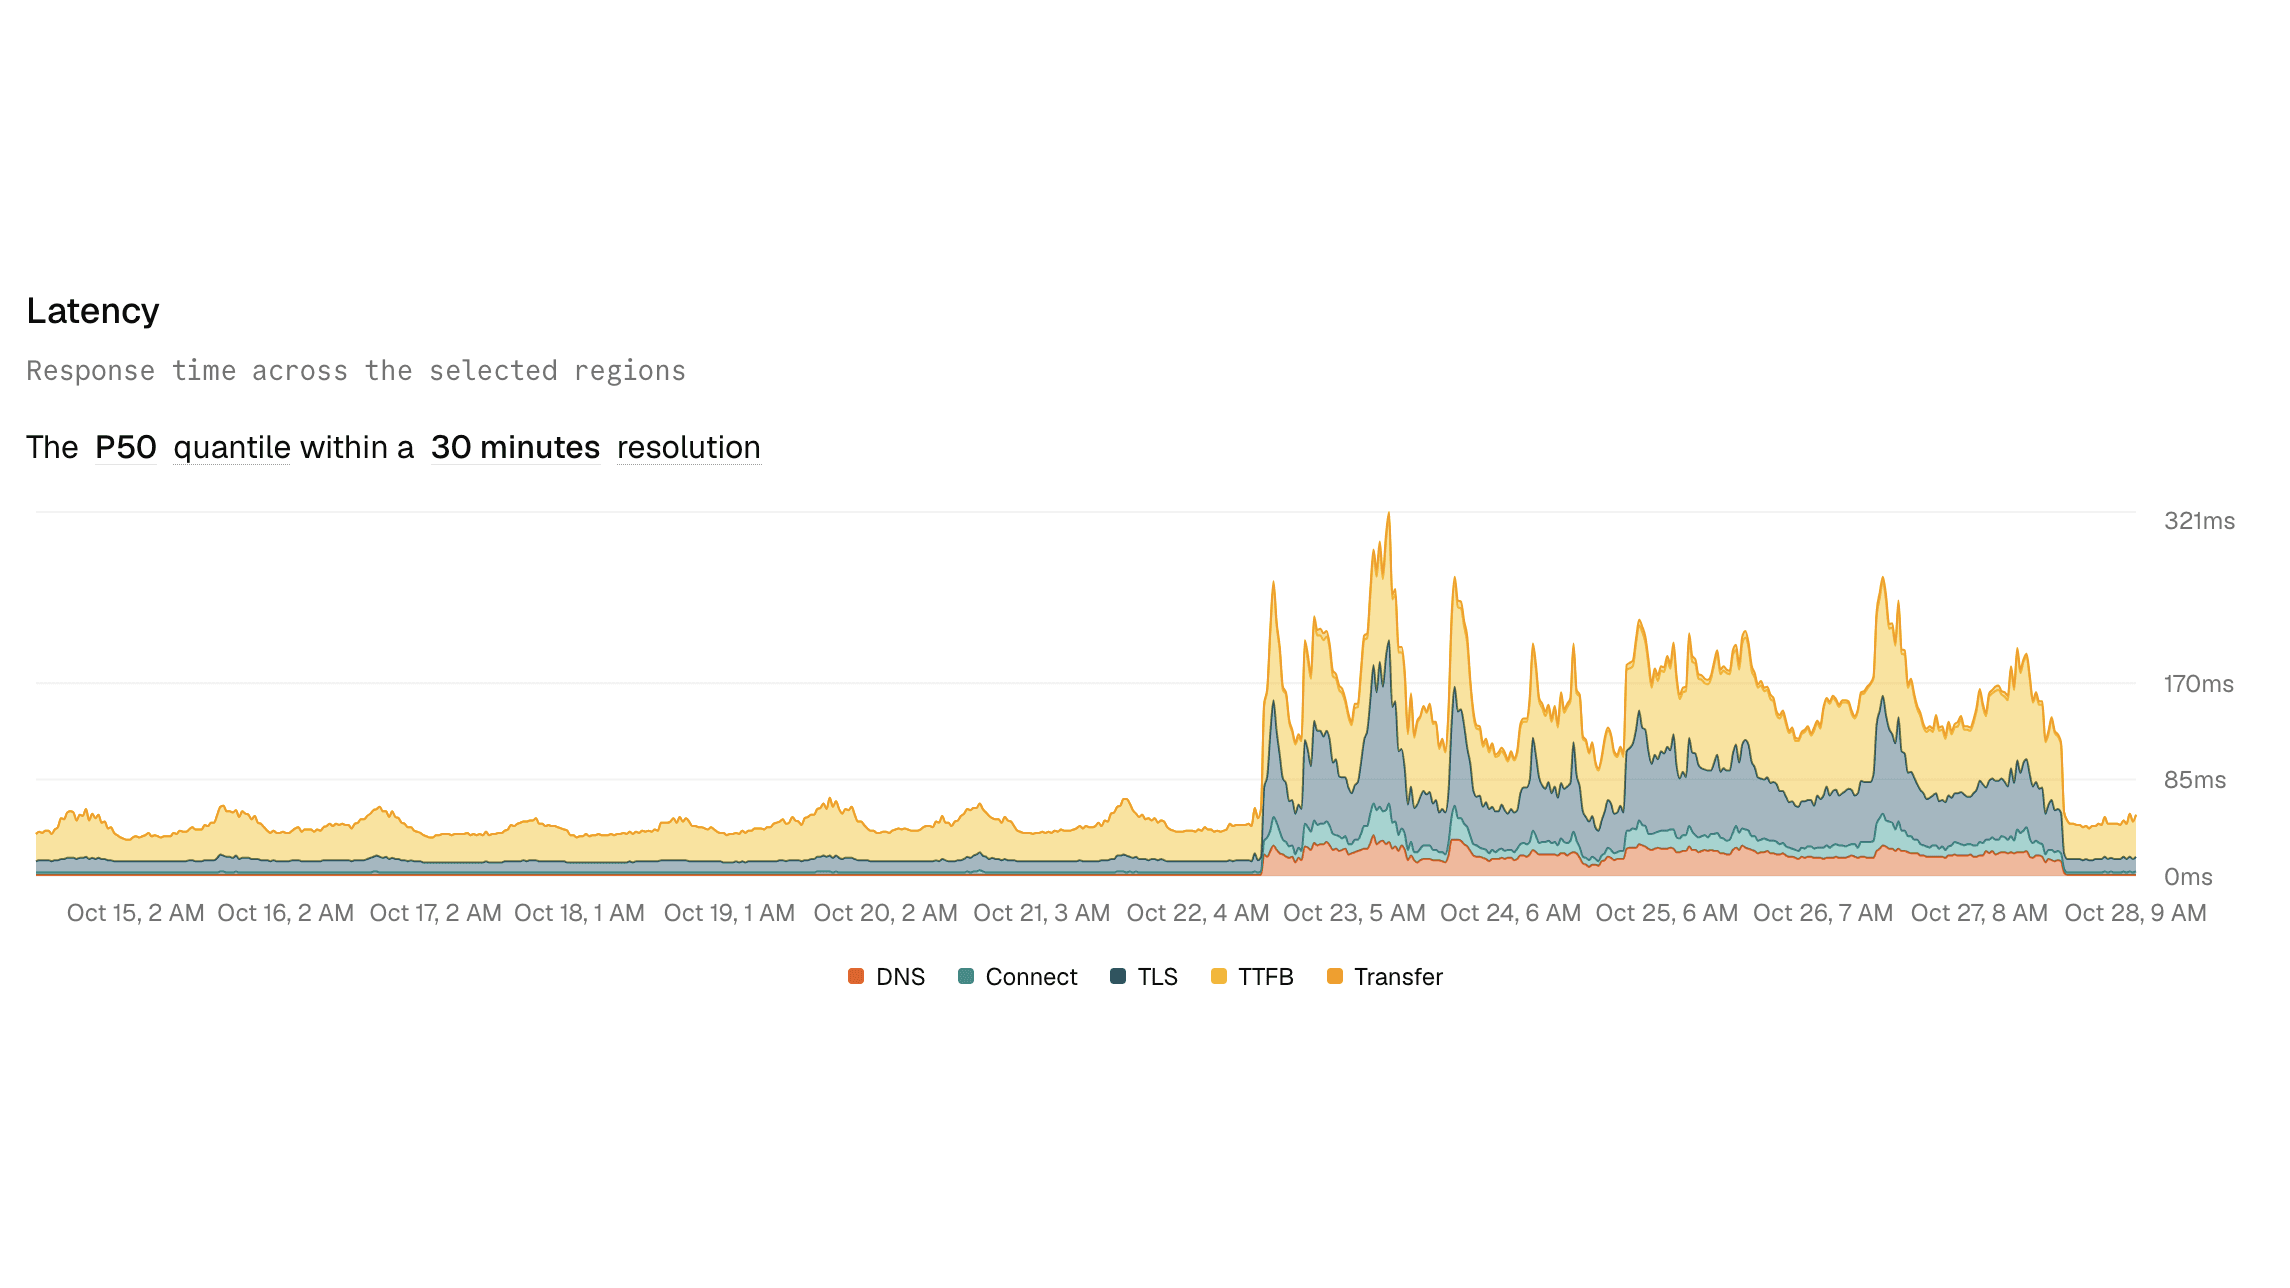
The P50 jumped from ~50 ms to 100–300 ms, mostly in DNS, connect, and TLS time.
The fix (#3010) was small. Instead of starting every check right at cronTimestamp, we add a deterministic delay between 0 and 2 seconds based on the hash of the monitor ID:
// spread maps a monitor to a fixed delay in [0, window): the same monitor keeps
// the same offset every tick, so its checks stay one interval apart.
func spread(monitorID string, window time.Duration) time.Duration {
	if window <= 0 {
		return 0
	}
	h := fnv.New64a()
	h.Write([]byte(monitorID))

	return time.Duration(h.Sum64() % uint64(window))
}
We used a hash of the monitor ID instead of random jitter so that each monitor keeps the same offset every minute. If we used a random delay on each run, a 30-second monitor wouldn't run every 30 seconds anymore—the gap between two checks would drift from tick to tick.
Using Claude Code during the rollout
After each merge, I had a Claude Code session open to watch the Pub/Sub metrics on GCP and the checker logs on Fly.
Ten minutes into our first attempt, the Pub/Sub metrics on GCP looked completely fine. Publish and ack rates matched, and Claude told me the consumers were keeping up. I still wanted to be sure nothing was failing on the workers, so I asked it to check the Fly logs:
it seems like it's working flawlessly ?
can you check the checker log/metrics on fly to see if there are any error
Two minutes later, it found the 1,400 Tinybird 429 errors in the logs and told me to roll back.
My prompts weren't anything fancy, typos included. Here is the one from the second switch after we deployed the batcher:
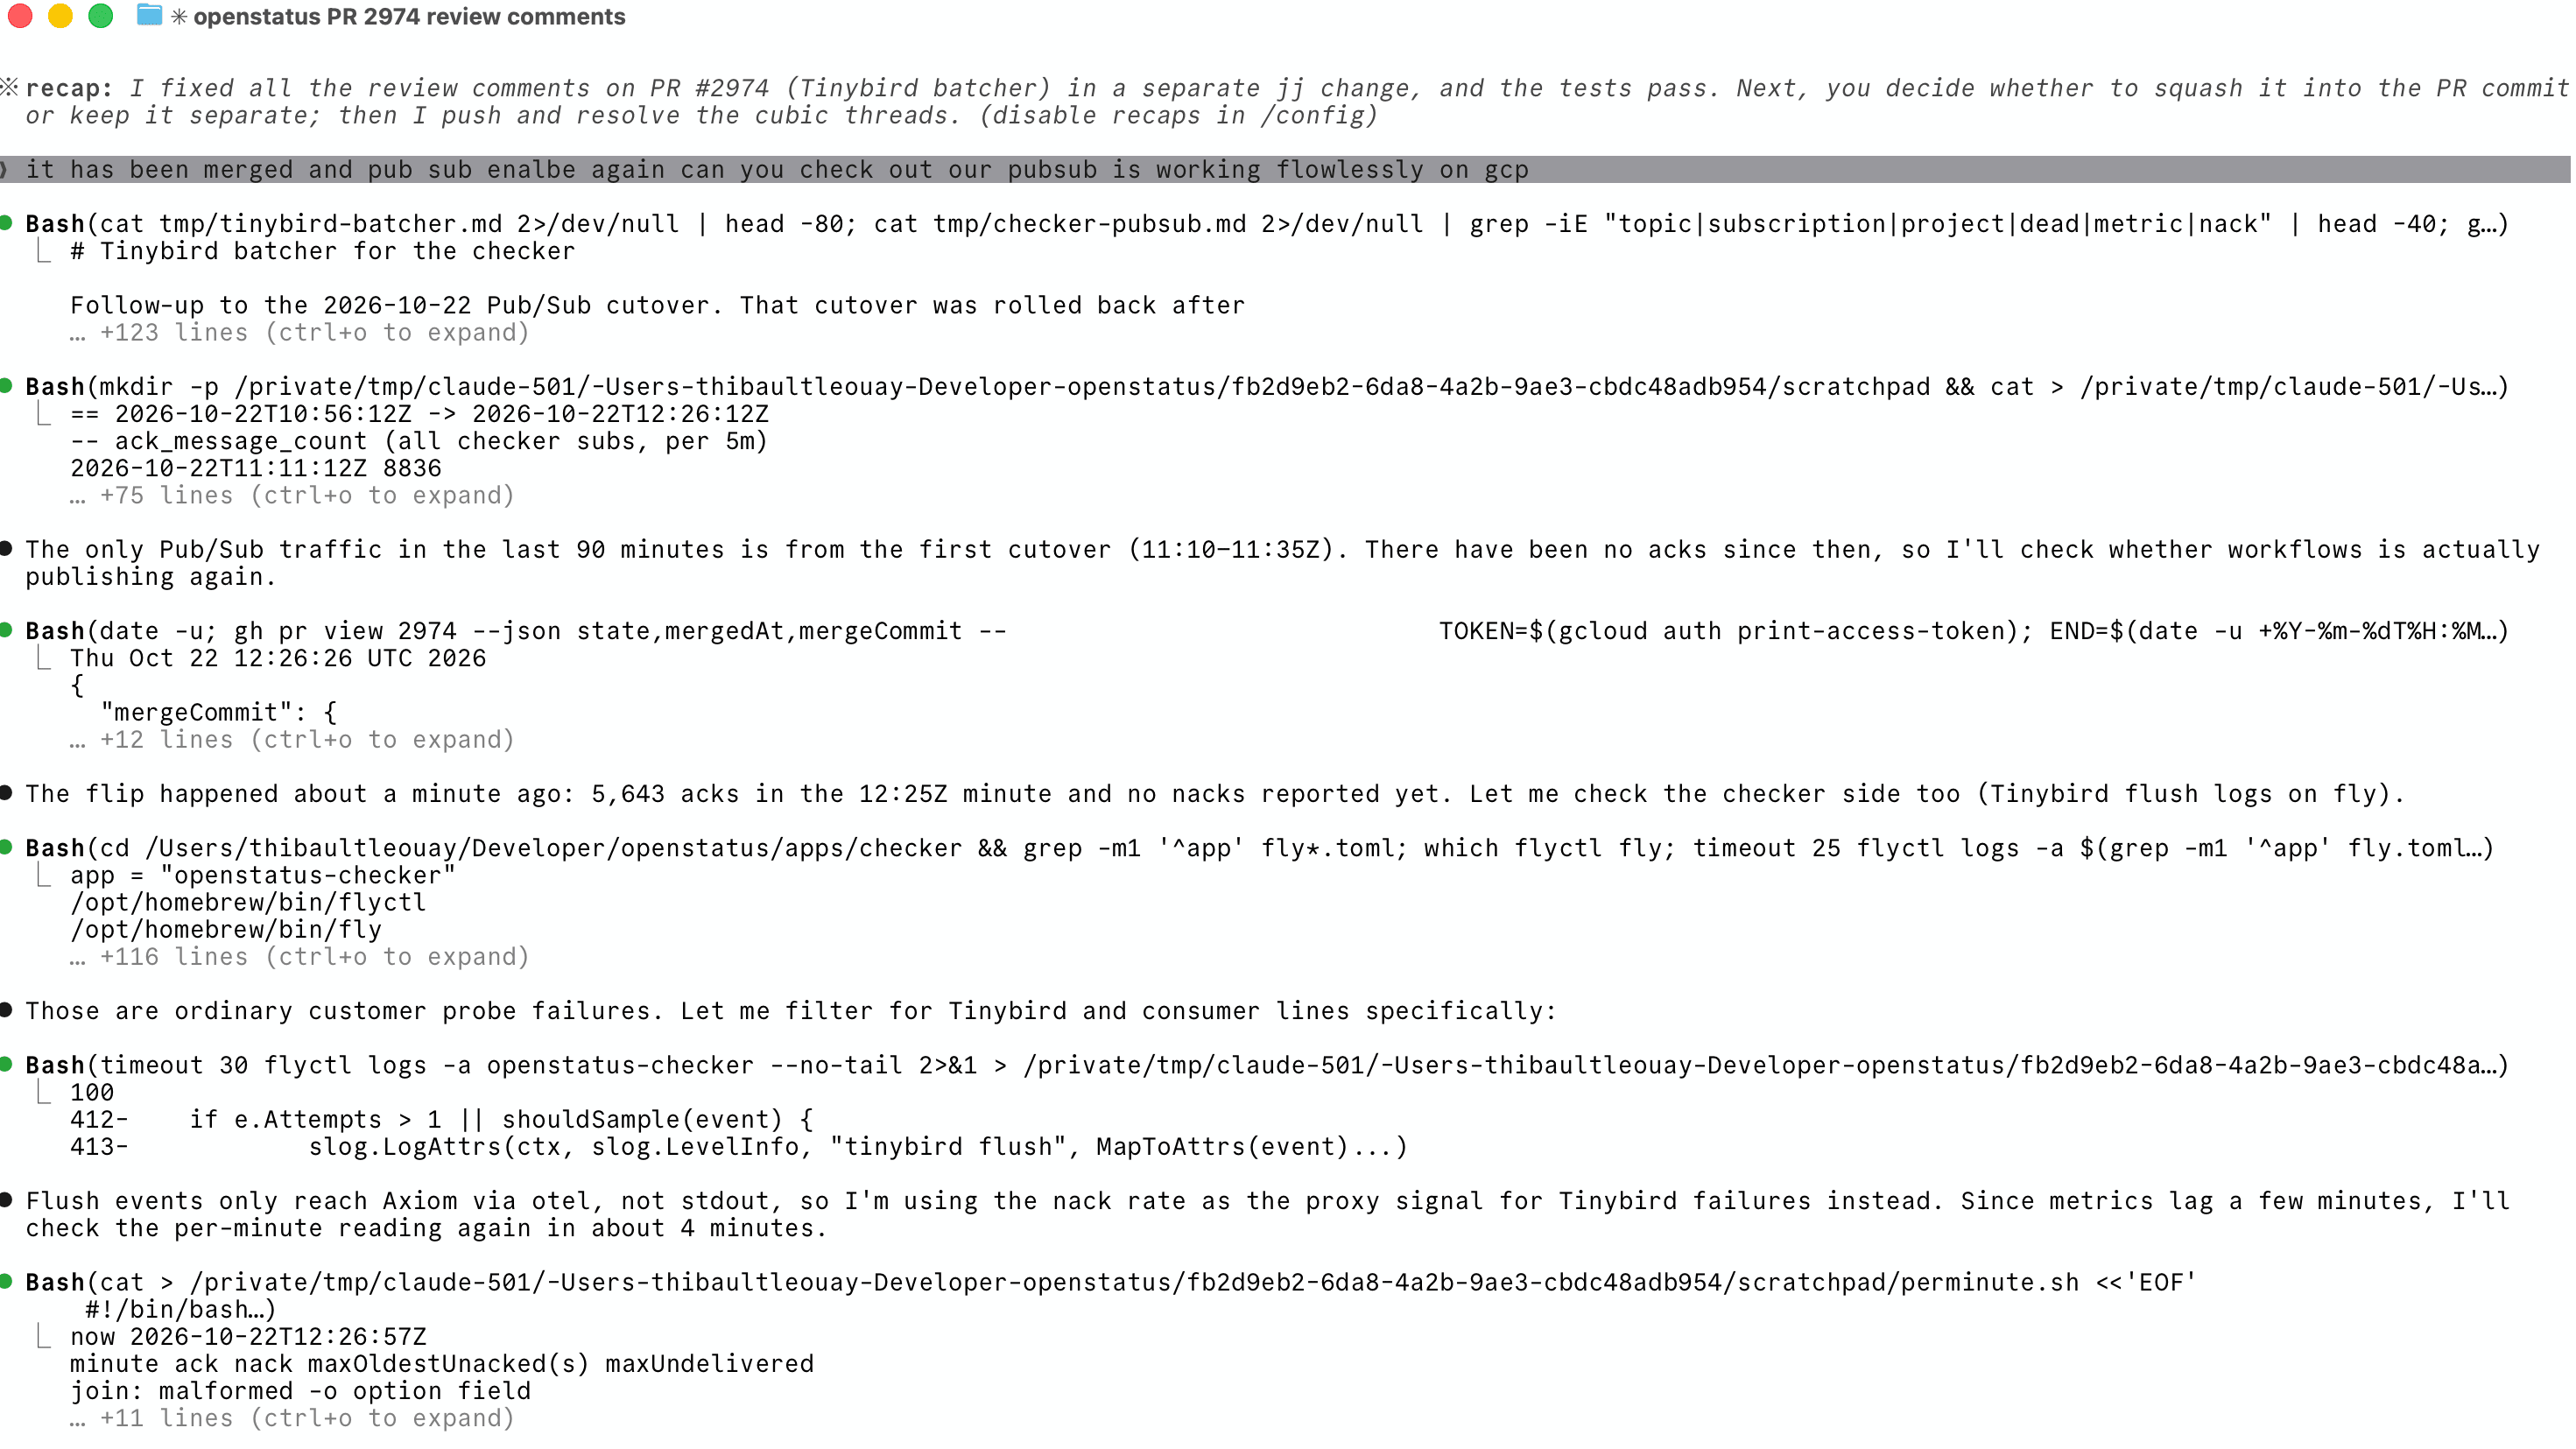
It pulled the metrics from GCP, checked the Fly logs, and gave me this summary two minutes in:
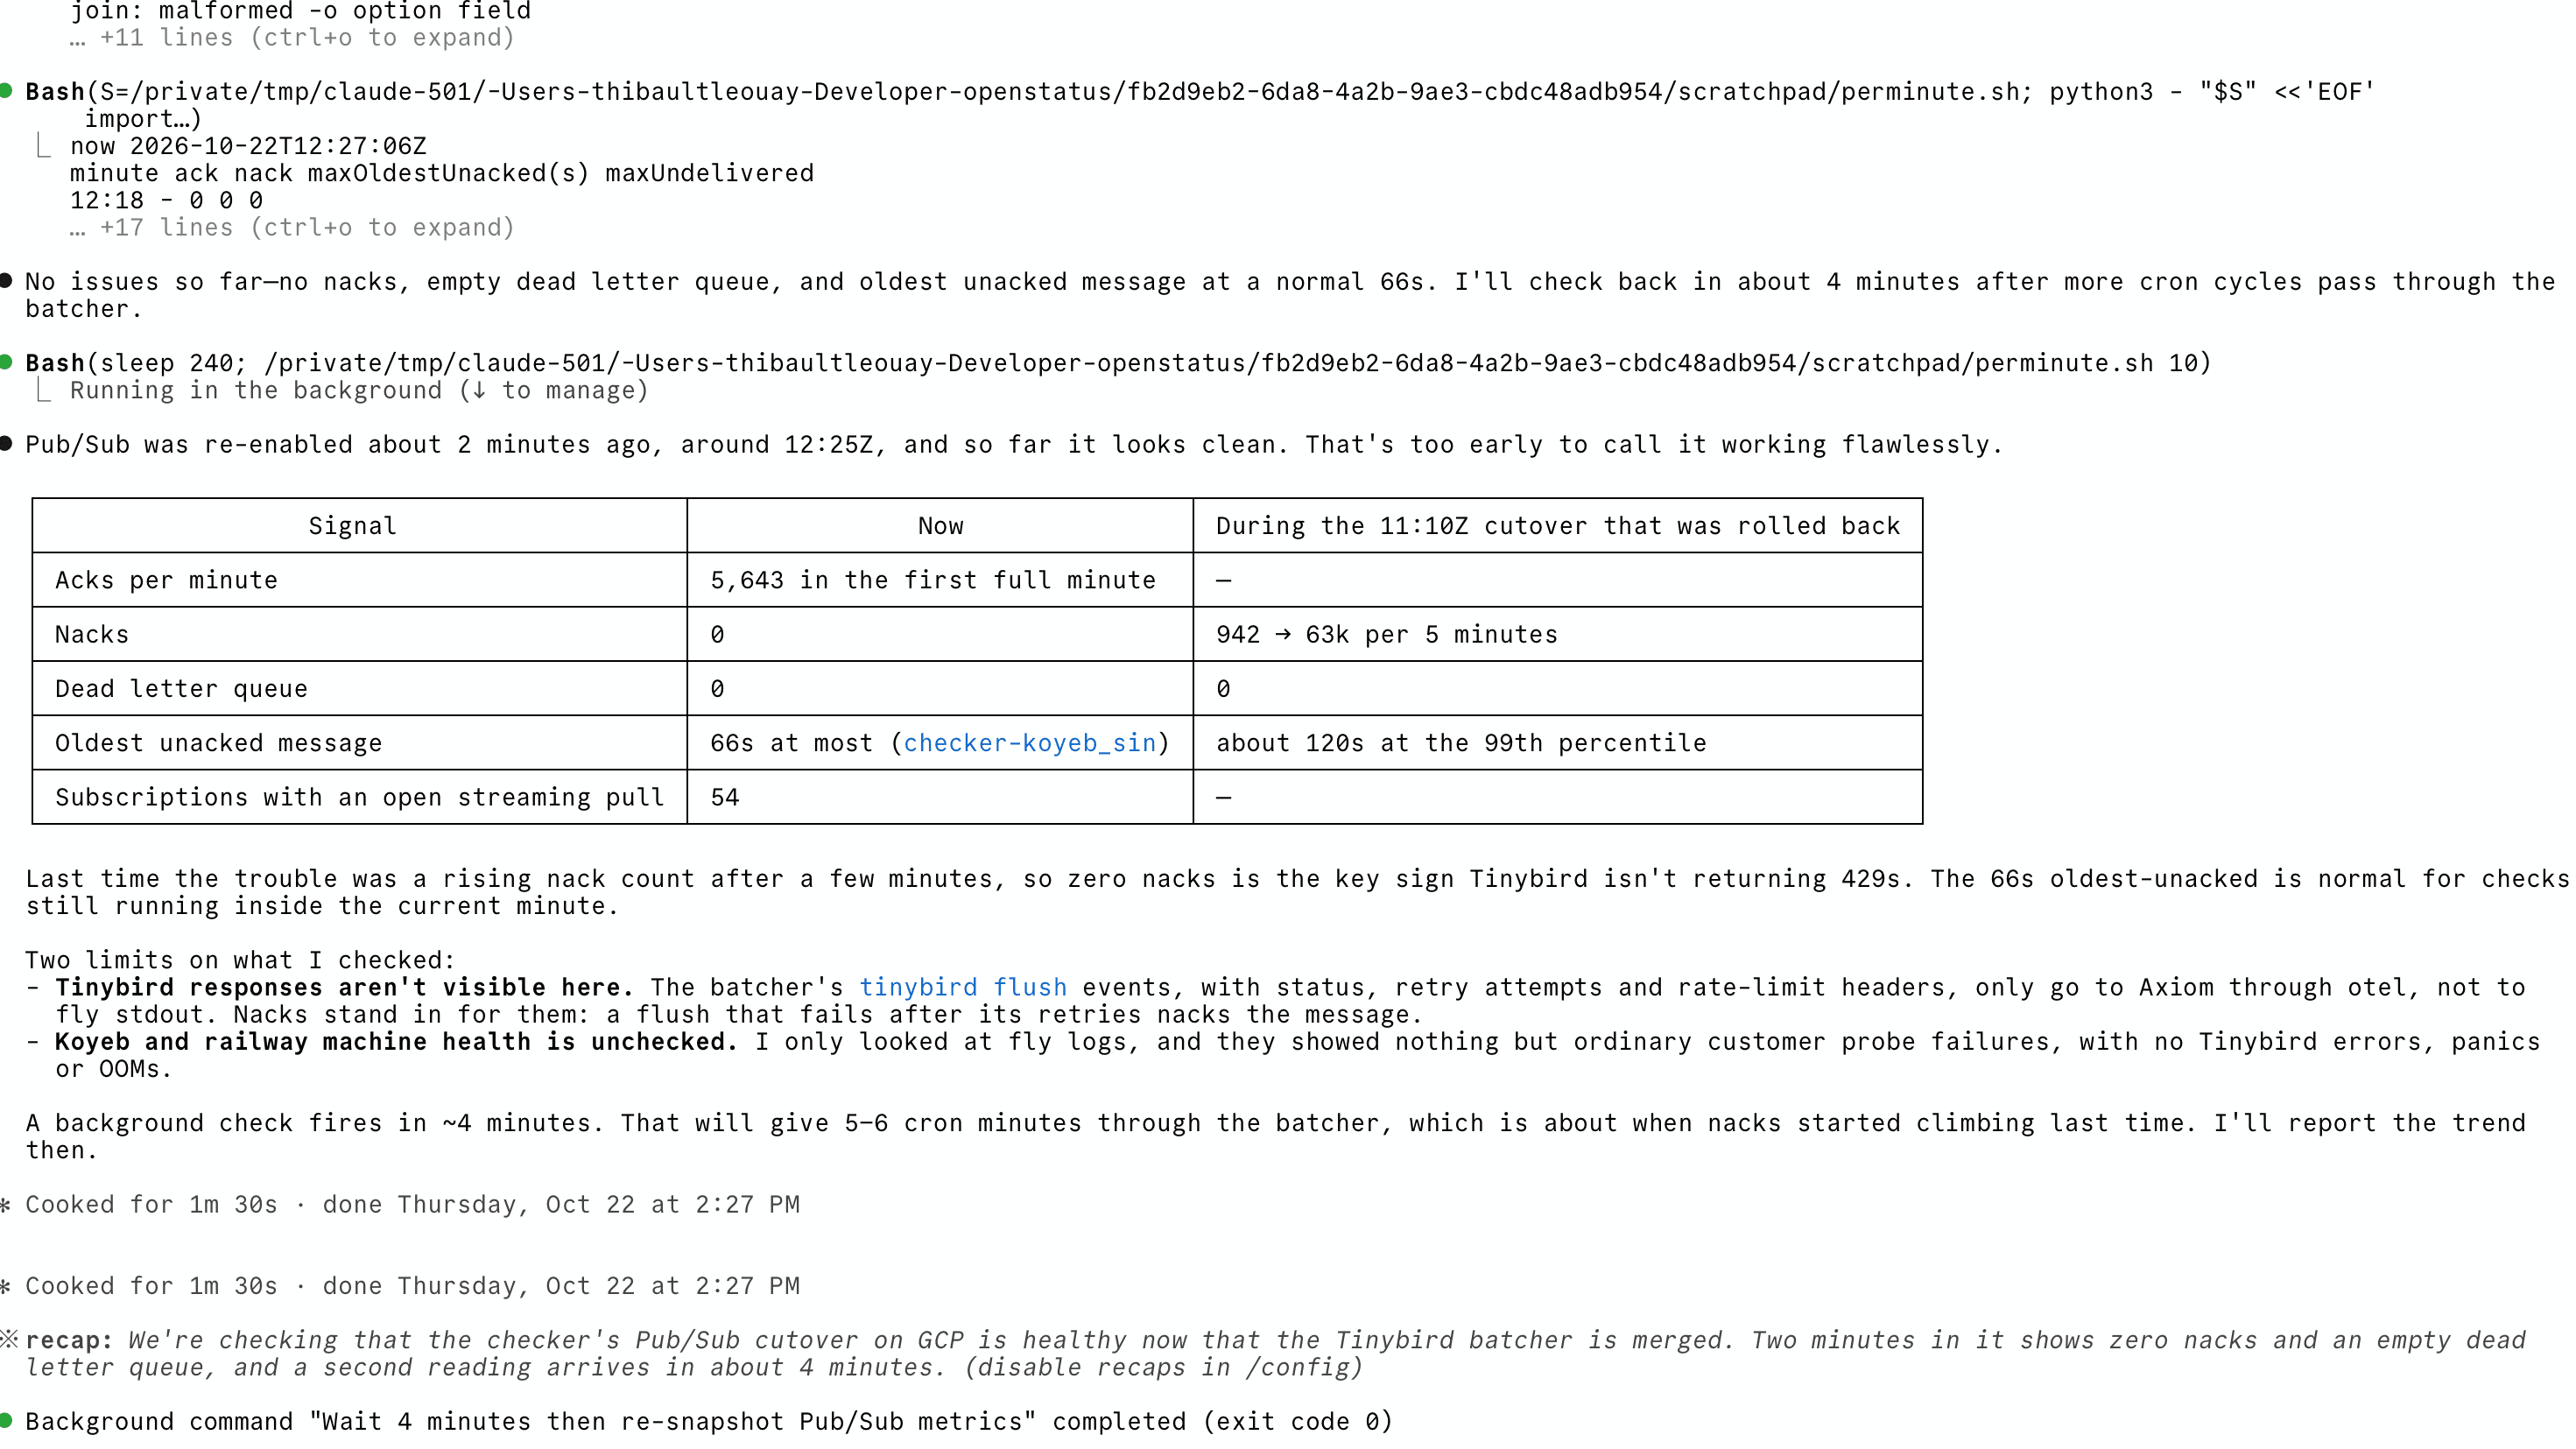
What I liked at the bottom of that report is that it pointed out what it couldn't see from my terminal—for example, Tinybird response codes only go to Axiom, so it used Pub/Sub nacks to check if writes were failing, and it noted that it hadn't checked the Koyeb or Railway machines.
Claude wrote the migration plan with me and still missed both load issues. And during the first rollout, it was just as fooled by the green Pub/Sub graphs as I was until I asked it to read the logs. Where it helped the most was how fast we could recover: we hit the Tinybird rate limit, wrote and tested the batcher, and deployed the fix all on the same afternoon.
Takeaways
Overall we're really happy with the move. Paying ~20€/month instead of ~200€/month for the queue is a nice win, and pulling jobs from the workers is much simpler than bouncing HTTP requests across regions.
A few things we learned along the way:
- A push queue with dispatch limits smooths out your traffic for free. When you switch to pull consumers that wake up on the same cron tick, everything downstream (like Tinybird, or even the network stack on the worker VM) suddenly gets hit with bursts instead of a steady stream.
- Don't re-run the whole job when only the database write at the end failed. Retrying the Tinybird request locally before nacking the Pub/Sub message saved us from re-running thousands of HTTP checks during a rate limit.
- Watch out for subscription filter pricing on Pub/Sub. Putting the region in the topic name instead of filtering a single topic across 27 subscriptions made the difference between an ~$11 bill and a ~$212 bill.