How we built an agent webhook for our status pages
Jun 04, 2026 | by Colin Ozanne | [engineering]

When a service goes down, the openstatus status page flips to red on its own. But that's all it says: a red bar and no explanation. Users can see something is wrong, they just can't tell what, how bad, or whether anyone is on it, so they open a ticket while the on-call engineer is already heads-down fixing the actual problem.
Thibault had the idea to close that gap: what if when an incident or alert is triggered, the webhook openstatus already fires didn't just trigger a script, but an agent that writes the status update itself? I picked it up and built it.
This is the story of how, the decisions that shaped it, and the things that bit me.
A webhook that hands off to an agent
openstatus already fires a webhook whenever a monitor changes state: error, degraded, or recovered.
Normally you point that at a script that forwards it somewhere.
I pointed it at an agent instead.
The flow is small.
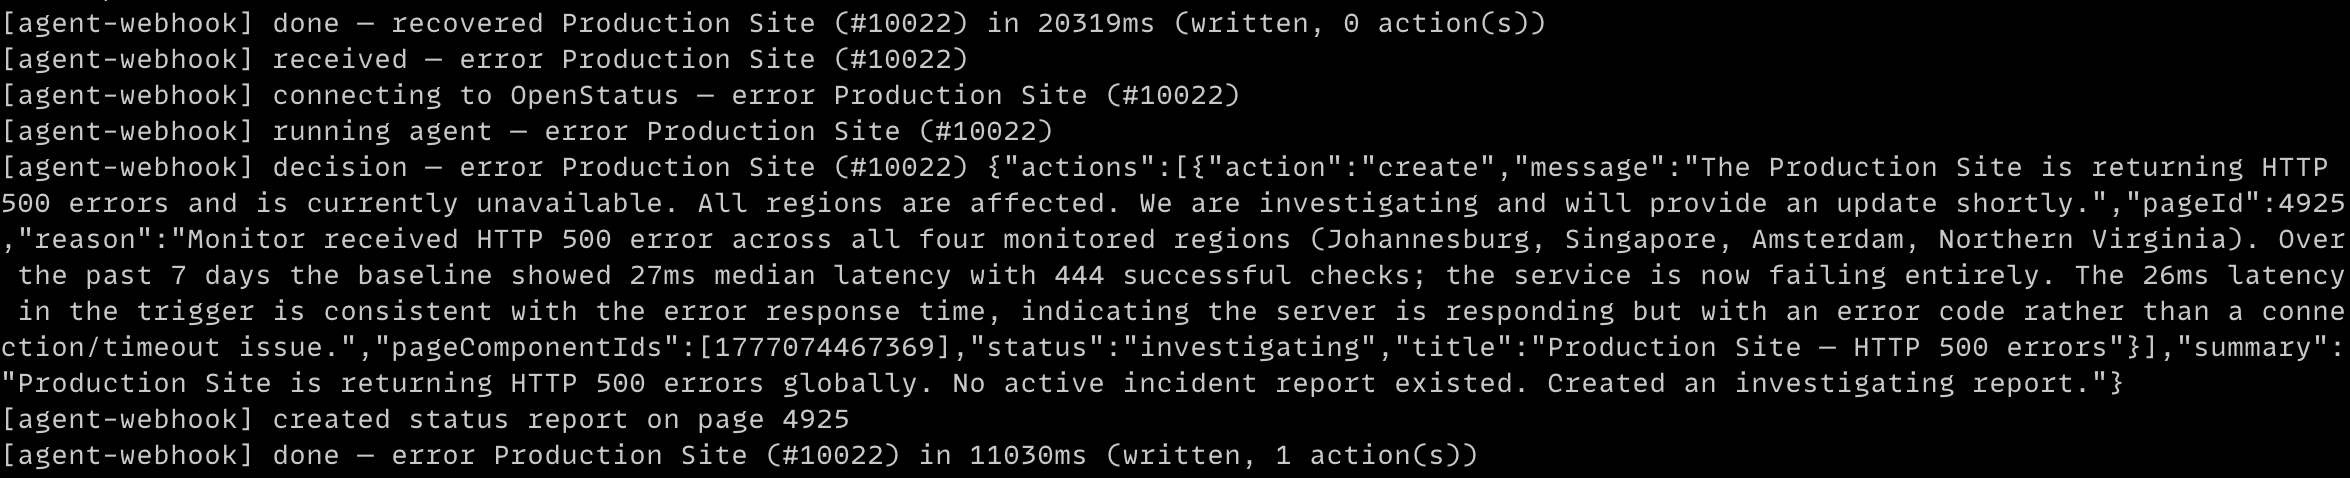
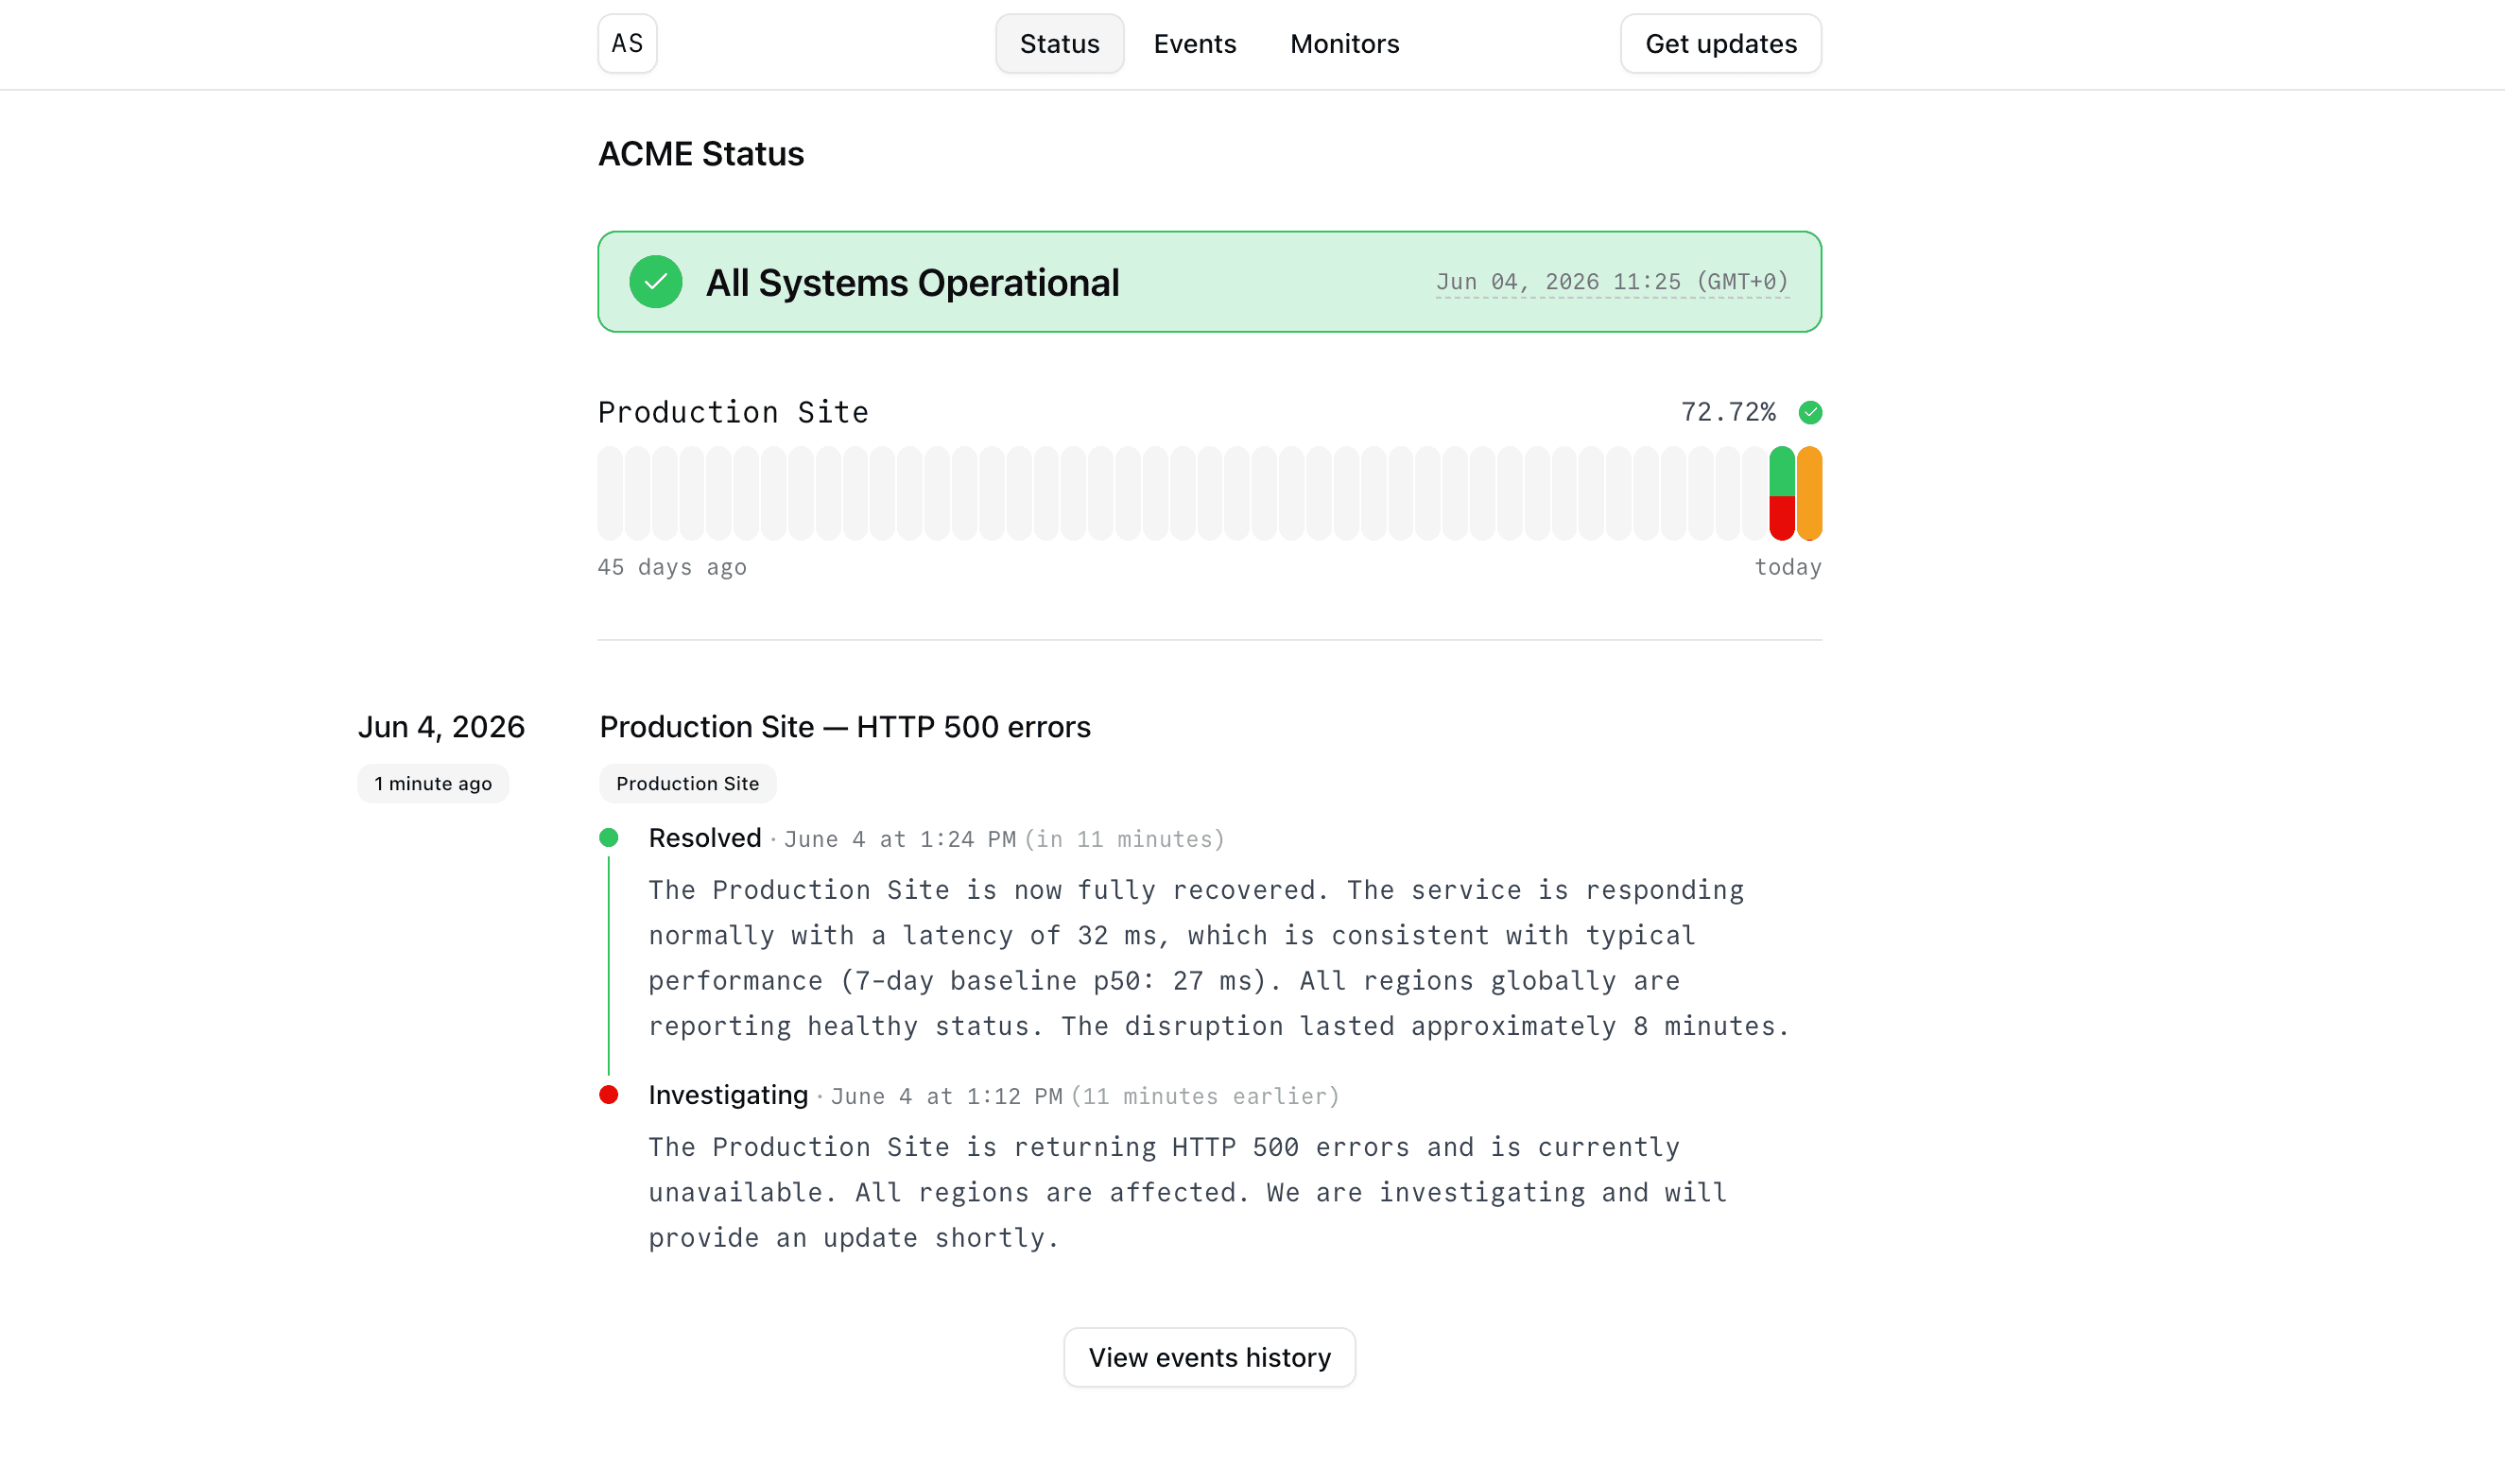
A monitor changes state, openstatus posts to /webhook, the agent investigates what's going on, and then it creates, updates, or resolves a report on the status page.
error and degraded open a report or update the one that's already live; recovered resolves it.
The entry point is deliberately dumb: it's just a validated payload. One arktype schema checks the body and hands off. The webhook doesn't care who sent it, which matters later.

The rule that shaped everything: the agent can read, but it can't act
We already have a Slack agent that drafts incidents, but a human approves everything before it goes out. Going fully autonomous removes that human and the safety net. So I built the safety right into the architecture instead.
The rule I settled on is that the agent writes the words, but it never gets to act.
It decides what the report says, what to title it, and which page it belongs on.
That's the power of the LLM I want to tap into.
What it never gets is a write tool.
All it can hand back is a decision, and the code does the actual writing, always with notify: false.
// The only tools the model can see, all read-only.
const readTools = {
  list_status_pages, list_page_components, list_status_reports,
  get_monitor, get_monitor_status, get_monitor_summary, list_response_logs
}

// The only thing that writes, and it forces notify: false on every call.
const write = (name, args) =>
  client.callTool({ name, arguments: { ...args, notify: false } })
So the worst a hallucination can do is publish a shaky report that a human deletes in a couple minutes. It can't page anyone, email your subscribers, or post the same incident twice.
That leaves one question: how do you trust it before letting it loose? Ultimately, you can't trust it entirely, LLMs are prone to hallucinations and inaccuracies, but you can definitely test it out a bunch to see what sort of output it gives. And the previously explained safeguards prevent any real damage.
That's what DRY_RUN is for, and it's on by default.
In dry-run the agent does everything for real, it investigates live events and writes the report it would publish, then logs that instead of posting it.
You watch it handle real incidents until you're happy with it.
Turning dry-run off doesn't sign off on the drafts you saw, it just hands over the keys: from then on every event gets a fresh investigation and freshly written wording, with no human in the loop.
Talking to openstatus over MCP
The agent doesn't get a private backdoor into openstatus. It talks to the same MCP server any agent would. It's just a home-made consumer of a public interface we already expose.
The agent itself is a single call:
const result = await generateText({
  model: env.AGENT_MODEL,            // anthropic/claude-haiku-4.5 via the AI Gateway
  system: buildSystemPrompt(),
  prompt: describeEvent(event),
  tools: client.readTools,
  stopWhen: stepCountIs(12),
  timeout: 60_000,
  output: Output.object({ schema: Decision })
})
return result.output
The output is the nice part: it's validated, not parsed. I describe the decision shape with arktype and let the AI SDK enforce it, so arktype won't let the agent hand over a broken decision object.
const Action = type({
  action: "'create' | 'update' | 'resolve'",
  reason: "string",
  message: "string",
  pageId: "number",
  "status?": "'investigating' | 'identified' | 'monitoring'",
  "title?": "string",
  "pageComponentIds?": "number[]",
  "statusReportId?": "number"
})

export const Decision = type({
  summary: "string",
  actions: Action.array()
})
arktype does the same job everywhere else too, checking the environment on boot and the incoming webhook body. (I love validation libraries, Standard Schema ftw)
The prompt was the actual work
Getting it to publish safely was the engineering. Getting it to write something worth reading was the finicky part.
A report that just echoes the alert is worthless. "The health check returned a 429" is something we could print without an AI, and it tells a customer nothing new or useful. So most of the prompt is spent pushing the agent away from that.
Before it writes anything, it has to investigate. It pulls the baseline to see how far from normal things really are, checks every region to work out the blast radius, and reads the recent failing checks to name the actual symptom. Then it has to put numbers on it. "The API is slow" vs "around 17x slower than usual, roughly 25 seconds against a typical 1.5".
The other half is voice. The reader is a customer, not someone on the team. They don't know or care that openstatus runs synthetic checks from probes around the world, so the agent is told never to mention any of it. It writes about the service, and frames affected regions as where users are, not where our probes sit.
Here are the different outputs that produces:
Weak: "Checks from the health endpoint are responding with HTTP 429 and connection timeouts. All 6 monitored regions report healthy status."
Strong: "The ACME Production Site is rejecting some requests with rate-limit (HTTP 429) errors, and connections are timing out for users in several regions. Requests that do complete are returning about 17x slower than usual (~25 s vs a typical 1.5 s). Impact appears widespread and is currently stable."
There's one last rule: when in doubt, publish. Silence during a real incident is the worst outcome there is. A false positive costs almost nothing, since it goes out without notifying anyone, so no one actually sees it, and a human can edit or delete it quickly.
The unglamorous plumbing
The rest is the boring stuff every webhook receiver needs.
The secret in the x-webhook-secret header is compared in constant time,
the endpoint acks straight away with a 202 and runs the slow agent work in the background,
and events are deduped in memory.
Where is my Alpine??
deno compile turns the whole thing into a single self-contained binary, which is perfect for a tiny container.
I first tried what I usually reach for, a multi-stage build with an Alpine final image (just base Alpine here since the binary is self-contained).
That doesn't work.
deno compile only targets glibc, there's no musl build, so the binary it produces is glibc-linked.
Alpine ships musl, not glibc, so the binary won't run there.
The confusing part is that the builder stage can still be the deno:2-alpine image: Deno itself runs on Alpine via its musl packaging, but compile still emits a glibc binary.
So the runtime base has to be glibc.
I used a Red Hat distroless image from Project Hummingbird: hardened, secure, and way smaller than a vanilla Debian base.
The container is then locked down in compose, with a read-only root filesystem, all capabilities dropped, and no-new-privileges.
CI builds the image, smoke-tests it (GET / returns ok, an unauthenticated POST /webhook returns 401), and pushes it to the registry.
Dogfooding found the cracks
Building a real consumer against our own API is the best documentation review. When you actually depend on the docs, the gaps show up fast.
The biggest one was a happy surprise. The MCP server already exposed a whole set of monitor and response-log read tools that the reference page never mentioned. Those tools are the reason this works at all: without them the agent would have nothing to investigate and nothing worth writing.
Some other smaller gaps too. The tool list was undercounted. The webhook payload was written up as a split between failure and recovery shapes, when the code actually sends one flat schema for every status.
Those findings are fixable easily. The harder problem is the one underneath them: docs drift from code. I don't have a clean answer yet. We could generate the docs straight from the schemas so they can't go stale. For now, we just build something real against our own product.
It doesn't have to be openstatus
Remember that the receiver only needs a valid payload and an agent. That's the cool part: the trigger doesn't have to be an openstatus monitor.
I wrote the schema to speak openstatus's webhook format, but a schema is easy to swap. Just adapt the schema, and the same agent will happily turn a Sentry issue, a Grafana alert, or a PagerDuty incident into a report on your openstatus status page.
The same goes for the MCP server. Right now it's only using the openstatus MCP, but give the LLM any other source of info and it can be included in the status report! If the service you're using doesn't offer an MCP server, you could also give it any CLI tool to call.
You still have to tell the agent which monitor and status page an incoming alert maps to, so it knows where to post and what to investigate.
Try it
It's all open source at openstatusHQ/agent-webhook.
It ships with DRY_RUN on, so the safe way in is to clone it, point a webhook at /webhook, and watch it reason through a few real events before you ever let it write.
Flip the flag once the logs look right.
deno task dev to run it, deno task test <recovered|error|degraded> to fire a fake event at it.
You can also just use it as-is with the pre-built Docker image. Just set the environment as required by the schema and you're good to point openstatus to your brand new autonomous webhook!